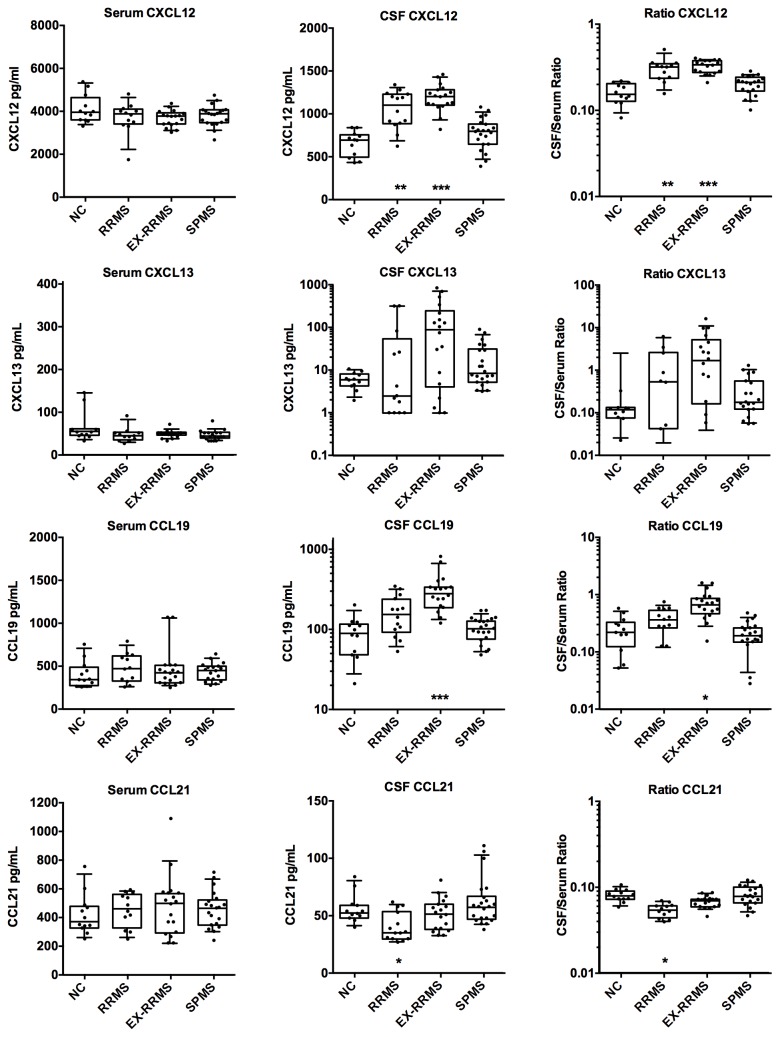
Figure 2. Comparison of the levels of the lymphoid chemokines CXCL12, CXCL13, CCL19 and CCL21 in serum and CSF.
Chemokine concentrations are plotted with box and whiskers (10-90% range) overlaid on the scatter plots (each patient is a symbol). The CSF/serum ratio is presented on the right side. Data are shown for normal controls (NC), relapsing-remitting MS (RRMS), RRMS patients with acute exacerbations (EX-RRMS) and secondary progressive MS patients (SPMS). In those cases with EX-RRMS (9), SPMS (11) and RRMS (2) patients with second lumbar punctures, data from both samples are included. Statistical significance was assessed using only the baseline data and is indicated by asterisks at the bottom of each graph (ANOVA). Data at the lower limit of quantitation were excluded from the ratio plots.

