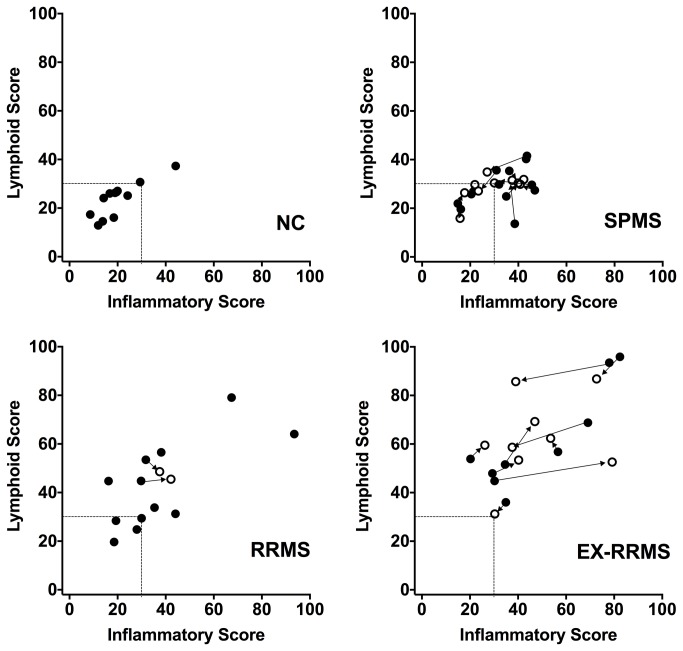
Figure 5. Relationship between the CSF lymphoid and inflammatory scores for MS patients and healthy normal controls.
Solid circles show the baseline data while open circles are from the repeat lumbar puncture. Lines with arrow heads indicate paired samples from each patient (most MS subjects from the RRMS group did not have two lumbar punctures).

