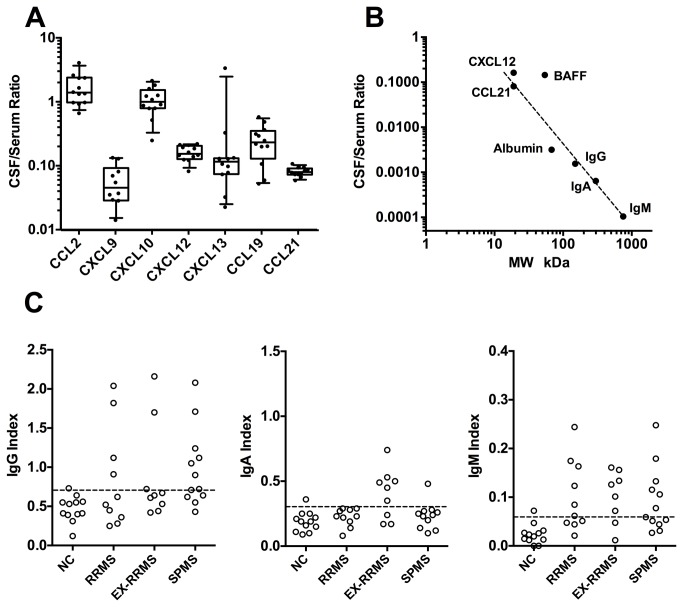
Figure 6. Ratio of CSF to serum chemokine levels in normal patients as well as the relationship to molecular size.
A). Ratio of the CSF to serum chemokine concentrations for normal controls. B). Relationship between the molecular weight of the analyte and the CSF/serum ratio (only normal subjects). Only CCL21 and CXCL12 are plotted and CXCL9, CXCL13 and CCL19 would roughly overlay these values. Chemokines were assumed to be dimeric, BAFF trimeric, IgG dimeric, IgA tetrameric and IgM pentameric. Values above the line are consistent with local CNS production. C). Corresponding Ig indices for the different cohorts.

