Abstract
Purpose
Isometric progressive resistance oropharyngeal (I-PRO) therapy improves swallowing function; however, current devices utilize a single sensor that provides limited information or are prohibitively expensive. This single-subject study presents results of I-PRO therapy, detraining, and maintenance using the 5-sensor Madison Oral Strengthening Therapeutic (MOST) device combined with upper esophageal sphincter (UES) dilatation.
Methods
A 56-year-old female nurse who was 27 months post stroke and subsequent to traditional behavioral interventions and UES dilatations presented limited to gastrostomy tube intake only and expectorating all saliva. She completed 8 weeks of I-PRO therapy, 5 weeks of detraining, and 9 weeks of I-PRO maintenance (reduced frequency) followed by a third UES dilatation post intervention. Data included diet inventory, lingual pressures (MOST), lingual volume (magnetic resonance imaging), postswallow residue (videofl uoroscopy), UES and pharyngeal pressures (high-resolution manometry), and quality of life (QOL).
Results
Findings after 8 weeks of I-PRO therapy were progression to general oral diet, 15 lb weight gain, increased isometric pressures (Δ >16 kPa) with transference to swallowing pressures, increased lingual volume (8.3%), reduced pharyngeal wall residue (P = .03), increased pharyngeal pressures (Δ > 43 mm Hg) and increased UES opening (nadir) pressures (Δ > 9 mm Hg) with improved temporopressure coordination across the pharynx, and improved QOL. After detraining, decreased isometric pressures and reduced UES opening were noted. After I-PRO maintenance, isometric anterior lingual pressures returned to levels noted after the 8 weeks of intervention.
Conclusion
I-PRO therapy, facilitated by the MOST device combined with instrumental UES dilatation, improved swallow safety, increased oropharyngeal intake, and facilitated UES opening while enriching QOL.
Keywords: deglutition, dysphagia, rehabilitation, strengthening, stroke
Swallowing problems, termed dysphagia, are a common comorbidity following stroke.1,2 Dysphagia secondary to brainstem strokes can occur in as many as 55% of patients and can result in the most severe swallowing compromise, potentially affecting timing of the pharyngeal swallow response, hyolaryngeal excursion, glottic closure, cricopharyngeal relaxation and opening, and orofacial sensation.3 These comorbidities can result in aspiration, which can lead to pneumonia, weight loss, and/or malnutrition.4 Mortality rates range from 20% to 62% in patients with aspiration pneumonia.5 Patients may require alternative means of nutrition, such as feeding tubes; however, these do not necessarily improve quality of life (QOL) nor extend survival.6,7 Patients can remain dysphagic well beyond acute hospitalization8 and thus require continued treatment long after discharge.
Common treatment strategies for dysphagia include orolingual strengthening and range of motion exercises, swallow-specific maneuvers (eg, supraglottic swallow), swallowing sensory stimulation/enhancement (eg, thermal stimulation), postural strategies (eg, head turn), and dietary modification.9,10 Whereas many strategies are patient-directed, device-facilitated therapies target a variety of swallowing-related tasks. Thermal stimulators or the Iowa Oral Performance Instrument (IOPI; IOPI Medical LLC, Carnation, WA, USA) may target enhanced sensory perception in the oral cavity or increased tongue strength, respectively. Device-facilitated isometric progressive resistance oropharyngeal (I-PRO) therapy using the IOPI has been shown to improve overall swallow function.11 The IOPI comprises a single air-fi lled plastic bulb attached to a hand-held pressure transducer that measures the pressure generated when the tongue is pressed against the hard palate. However, the smooth plastic bulb, with lack of registration to static anatomy, can cause the bulb to slide in the oral cavity as patients apply pressure and may cause variable pressure readings due to inconsistent placement between presses. In contrast, the recently developed Madison Oral Strengthening Therapeutic (MOST) device 1.0 (Swallow Solutions LLC, Madison, WI, USA) has an intraoral mouthpiece that comprises 5 air-filled sensors that independently target the anterior, posterior, left, right, and middle tongue as well as the whole tongue simultaneously by taking a composite measure of all the sensors at once.12,13 This mouthpiece is custom-fit to the hard palate, registered to the anterior upper dentition or alveolar ridge, facilitating easy and consistent placement over time.
Oral motor therapies, such as I-PRO therapy, are studied for their efficacy for influencing outcomes of bulbar-innervated mechanisms such as speech and swallowing. A primary criticism in the literature is that oral motor therapy does not target training specificity (ie, training a particular skill to improve a specific function), which exercise science demonstrates is a key principle of exercise.14 Nonetheless, strength training based on the overload principle, a fundamental principle of exercise,15,16 results in greater lingual isometric and swallowing pressures. Overload requires application of a load (intensity) greater than the typical load a body encounters to facilitate adaptation. Strengthening further requires a systematic increase in that overload to match the body as it gradually adapts over a set period (frequency) of exercise. With respect to swallowing, device-facilitated I-PRO therapy has been shown to transfer from a nonspecific isometric lingual strengthening task to improved swallow function.17,18
This case study describes the effects of an 8-week MOST-facilitated I-PRO strengthening intervention, including detraining and therapeutic maintenance periods followed by dilatation of the upper esophageal sphincter (UES), on profound dysphagia associated with complex stroke including the brainstem. The purpose is to investigate the first application of a novel device for an established therapeutic intervention in chronic and profound dysphagia.
Swallowing History
Acute/subacute setting
J.B., a 59-year-old female, experienced a stroke in early November 2008, resulting in left hemiparesis but no significant swallowing problems. She had a second stroke later that same month and was subsequently diagnosed with infected endocarditis and multiple embolic strokes in locations including the brainstem. Resultant deficits included profound dysphagia requiring gastrostomy tube (G-tube) placement, facial nerve paralysis, right hemiparesis and numbness, and ataxia. Tracheostomy tube placement was also required. Figure 1 exhibits the following swallowing history.
Figure 1.
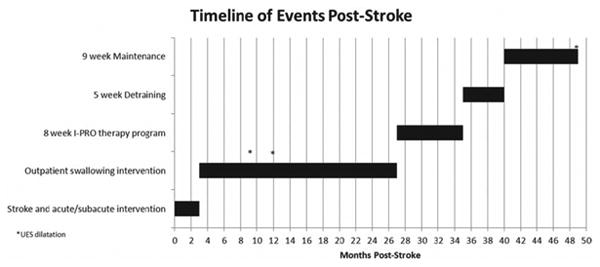
Timeline of events, including multiple interventions for swallowing and dilatations of the upper esophageal sphincter (UES). Y-axis markers correspond to headings and subheadings in the swallowing history, methods, and detraining/maintenance sections.
Approximately 3 months post stroke, J.B. began to receive outpatient speech therapy services (records not available to authors). She had a tracheostomy tube in place and ambulated independently with residual ataxia. She had right facial numbness and remained dependent on a G-tube to meet all nutritional, hydrational, and medicinal needs; she managed all secretions by expectorating into a cup. J.B. reported the inability to continue her pre-morbid activities and lifestyle secondary to the devastating loss of swallowing function, general physical weakness, and ambulatory difficulties.
Outpatient rehabilitation (7 months post stroke)
J.B. was referred to an otolaryngologist for airway assessment and was weaned from her trachesotomy tube 7 months post stroke. She was seen by a speech-language pathologist for re-assessment of swallow function and potential treatment courses. Diagnostic findings from a videofluoroscopic swallow study at 7 months post stroke revealed reduced tongue base retraction, reduced pharyngeal constriction, and reduced pharyngeal shortening as evidenced by resultant diffuse and severe pharyngeal stasis. Aspiration was visualized with videofluoroscopy after the swallow on both thin and nectar-thick liquids. She was recommended to remain at NPO status and continued to expectorate all saliva.
Over the subsequent 20 months, J.B. received traditional dysphagia therapy and an intensive, daily home practice program including swallowing-specific maneuvers (eg, Mendelsohn), range of movement exercises, and electrical stimulation (E-stim) during saliva swallowing tasks. She also underwent high-resolution pharyngeal manometry studies to evaluate for surgical intervention, based on and following which she underwent UES dilatation and CO2 laser myotomy of the cricopharyngeus at 9 months and 12 months post stroke, respectively. Her swallowing was monitored by high-resolution pharyngeal manometry approximately every 8 weeks, and she was recommended for a second UES dilatation at 19 months post stroke. J.B. reported no perceived benefit from these procedures. She remained totally dependent on her G-tube and unable to swallow her secretions throughout this treatment period. About this time, J.B. began to crave the taste of food and drink. In an attempt to satisfy cravings, she placed food or drink in her mouth, chewed or swished, then expectorated the material.
Repeat videofluoroscopy at 25 months post stroke showed liquid pooling on the vocal folds and in the pyriform sinuses, minimal UES opening secondary to right-sided pharyngeal paresis with roughly 1 mL of administered fl uid at a time passing through the opening, and aspiration of the remaining 3 mL of administered fluid when swallowing in head neutral position. A tight right head turn combined with a left head tilt, towards the stronger side of the oral cavity, facilitated a greater amount of bolus flow into the esophagus. However, this was still a minimal quantity, requiring 4 to 5 repeat swallows with residuals remaining in the pyriform sinuses and adjacent to the airway and aspiration of the remaining bolus. Additionally, maximal lingual pressures were measured using the IOPI, with the anterior tongue generating maximum pressure of 44 kPa and the posterior tongue generating maximum pressure of 39 kPa. These values were at the low end of normal, sloping to below normal limits for the patient's age and gender.18 Despite the new postural strategy, J.B. remained unable to take adequate life-sustaining or satisfying nutrition and hydration orally, continued to be totally dependent on her G-tube, and carried a spittoon at all times. Initiation of an 8-week period of device-facilitated I-PRO therapy was clinically warranted based on the objective measurements of lingual strength/weakness, diffuse and significant postswallow pharyngeal residue, and narrowed UES opening during very effortful and fatiguing swallowing.
Methods
I-PRO intervention (27 months post stroke)
J.B. initiated an 8-week MOST device-facilitated I-PRO therapy program more than 2 years post stroke. Therapy focused on the anterior and posterior tongue each sequentially via 10 lingual press repetitions, 3 times daily, 3 days per week for a period of 8 weeks as recommended in the sports medicine literature.15 The middle, right, and left tongue areas were not the foci of intervention as she had no clearly diagnosed unilateral lingual paresis or other damage, and the anterior and posterior tongue areas have been shown as effective strengthening targets.18 During baseline data collection, a 1-repetition maximum (1-RM) pressure was generated and recorded.19 J.B.'s 1-RM was identified as the highest pressure generated from 2 sets of 3 trials, where the sets differed by 5% or less, to account for natural variability. Therapy targets were calculated from the baseline 1-RM as 60% of the maximum for each targeted sensor for the first week of therapy and 80% of the maximum for the second week. New 1-RMs were measured at weeks 3, 5, and 7, and therapy targets were recalculated at 80% of new maximum pressure generations for each targeted sensor for the remaining weeks.
The MOST 1.0 uses a small netbook computer attached to a custom-fit mouthpiece with 5 air-filled sensors that record changes in pressure generated as the patient applies and maintains lingual pressure against the sensors. The anterior sensor registers at the alveolar ridge and the posterior sensor registers approximately at the juncture of the hard and soft palates. The anterior sensor is spaced 11 mm from the middle sensor, and the posterior, right, and left sensors are each spaced 6 mm from the middle sensor. The software included with the device automatically records each lingual press repetition and pressure data for later retrieval and analysis. J.B. received knowledge of performance via onscreen graphics that indicated her reach and maintenance of target pressures.
The Montreal Cognitive Assessment (MoCA) was administered to screen for cognitive impairment, which revealed cognitive function within normal limits.20 J.B. was then trained by 2 of the authors to independently use the MOST device over 2 sessions, following which she took the MOST home to initiate I-PRO intervention. She did not participate in any other speech or swallowing therapy during the intervention, detraining, or maintenance periods unless specifically directed by us.
Detraining (35 months post stroke) and maintenance (40 months post stroke)
At the end of the intensive 8-week intervention, J.B. completed a 5-week detraining period, during which she completed no lingual strengthening therapy. This was followed by a 9-week maintenance program of hard lingual presses to the roof of the mouth with the anterior and posterior tongue in sets of 10, 3 times daily, once weekly, without a device.21 Maximum isometric lingual pressures were re-measured at the beginning and end of the detraining and maintenance periods.
Outcome measures
Primary outcome measures were collected at baseline, week 4, and week 8: maximum isometric lingual pressures, maximum oral pressures during swallowing, bolus flow kinematics, and lingual volume. Secondary measures were collected at baseline and week 8: dysphagia-specific QOL and diet record.
Pharyngeal pressures were collected with high-resolution pharyngeal manometry only at the end of the maintenance period, and 2 primary outcome measures were chosen to repeat at the beginning of detraining and maintenance: maximum isometric lingual pressures and bolus flow kinematics.
Lingual pressures
Maximum isometric lingual pressures
Maximum pressures generated isometrically were recorded for the anterior, right, left, posterior, and whole tongue areas using the MOST device. J.B. was seated upright and instructed to “press as hard as you can.” Press referred specifically to her tongue pushing against an individual sensor as hard as possible for 3 seconds. Individual sensor presses were presented in the same order each time. For the whole tongue press, J.B. was instructed to “press your whole tongue as hard as you can against the roof of your mouth.” A whole tongue press referred specifically to JB taking her whole tongue and pushing against all the sensors simultaneously. Two sets of 3 trials were collected for each individual tongue/sensor location, which were then repeated for each whole tongue press.
J.B. was encouraged verbally during the targeted sensor, maximum pressure measurement, and remeasurement trials.22 She completed all other isometric trials alone in her home environment.
Maximum lingual pressures during swallowing
Maximum pressures generated during swallowing were measured using 3 air-filled sensors (diameter 13 mm; spacing 8 mm) attached to a silica strip. The strip was adhered longitudinally along the midline of the hard palate using Stomahesive (ConvaTec, Princeton, NJ, USA), with the anterior sensor positioned at the alveolar ridge and the posterior sensor at the approximate junction of the hard and soft palates. The sensor array was connected to a transducer that was suspended from the neck by a strap. Pressure data were sampled at 250 Hz and time-linked to videofluoroscopic swallowing images via the KayPENTAX Digital Swallowing Workstation (KayPENTAX, Montvale, NJ, USA). Pressure analysis extended from the time of onset of posterior bolus movement in the oral cavity until the bolus tail passed the ramus of the mandible.
Bolus flow kinematics
Videofluoroscopy was recorded at 25 frames per second and performed in the lateral and antero-posterior views with the following borders visualized: the lips anteriorly, the pharyngeal wall posteriorly, the hard palate superiorly, and approximately the cervical esophagus inferiorly. A total of 12 swallows, consisting of 4 bolus types, were performed at each videofluoroscopic swallow study: 3 swallows each of 3 mL thin liquid (Varibar Thin Liquid), 10 mL thin liquid, and 3 mL semisolid (Varibar Pudding); and 1 patient-controlled bolus of thin liquid from a cup (Bracco Diagnostics Inc., Princeton, NJ, USA). The 3 mL boluses were presented by spoon and 10 mL boluses by a catheter-tip syringe. The patient was instructed to “take a sip as you normally would” for the patient-controlled bolus task. Analysis was performed using only the lateral view.
Direction
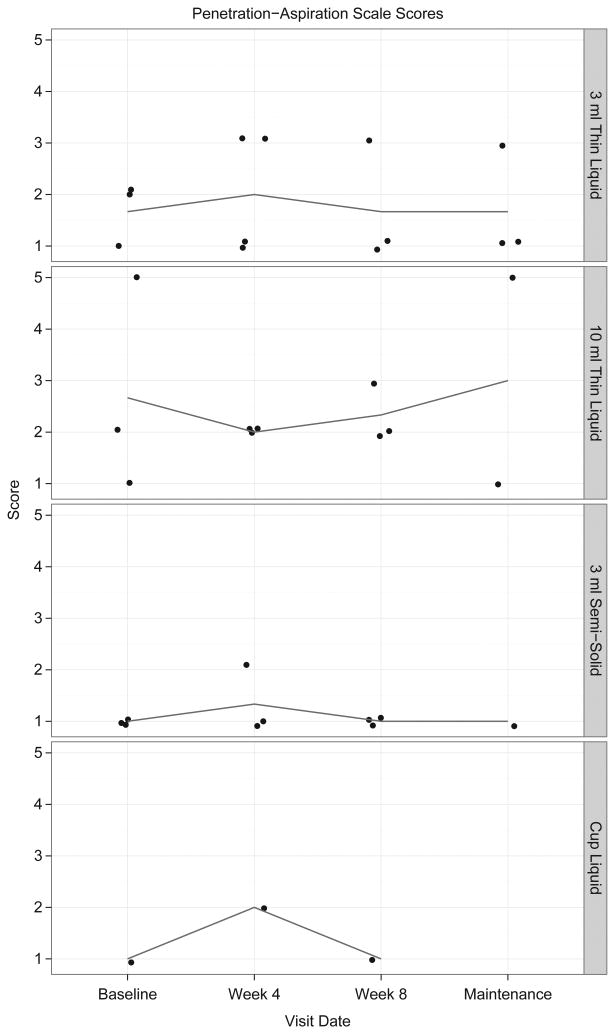
The 8-point Penetration-Aspiration Scale was used to score each swallow observed under fluoroscopy,23,24 representing the occurrence, anatomic depth, patient response to, and clearance of material invading the laryngeal vestibule or trachea.
Duration
Durational measures of bolus transit and clearance were completed using definitions found in Table 1.
Table 1. Operational definitions of bolus flow durations and timing measures collected at each video fluoroscopic swallowing assessment.
| Duration | Definition |
|---|---|
| Oral transit duration (OTD) | Time from beginning of posterior bolus movement until arrival of bolus head at ramus of mandible |
| Oral clearance duration (OCD) | Time from beginning of posterior bolus movement until arrival of bolus tail at ramus of mandible |
| Duration of laryngeal vestibule closure (LVC) | Time from first contact between arytenoids and base of epiglottis until last contact |
| Stage transition duration (STD) | Time between first maximum hyoid elevation and bolus head enters pharynx |
| Pharyngeal transit duration (PTD) | Time from arrival of bolus head at ramus of mandible until bolus head entering UES |
| Pharyngeal clearance duration (PCD) | Time from arrival of bolus head at ramus of mandible until bolus tail entering UES |
| Pharyngeal response duration (PRD) | Time from beginning of hyoid excursion until hyoid returns to rest |
| Duration of hyoid maximum elevation (DOHME) | Time from first maximum hyoid elevation until last maximum hyoid elevation (duration hyoid remains maximally elevated before depressing) |
| Duration of hyoid maximum anterior excursion (DOHMAE) | Time from first maximum hyoid anterior excursion until last maximum hyoid anterior excursion (duration hyoid remains maximally elevated in anterior excursion position before depressing) |
| Duration to UES opening (DTCPO) | Time from beginning of posterior bolus movement in oral cavity until UES opening |
| Duration of UES opening (DOCPO) | Time from UES opening until UES closed |
| Beginning of LVC and when bolus head enters pharynx (BLVC-HEP) | Time between beginning of LVC and when bolus head enters pharynx |
| Beginning of LVC and beginning of maximum hyoid elevation (BLVC-MHE) | Time between beginning of LVC and first maximal hyoid elevation |
| Total swallowing duration (TSD) | Time from beginning of posterior bolus movement in oral cavity until hyoid returns to rest |
Note : UES = upper esophageal sphincter.
Residue
Barium residue was rated after each swallow on a 3-point scale (0 = no residue, 1 = a line coating of residue, 2 = pooling of residue), and measured in the following locations: oral cavity, valleculae, posterior pharyngeal wall, pyriform sinuses, and the UES.11
Lingual volume
A 1.5T GE magnetic imaging scanner (Signa LX, GE Medical Systems, Milwaukee, WI, USA) and 8-channel head coil were used to obtain anatomic images progressing from the anterior incisors to the posterior epiglottis. Coronal T1- and T2-weighted fast spin-echo pulse sequence images were acquired with the following scan parameters: repetition time and echo time between pulses, 600 ms and 23 ms, respectively; field of view, 20 cm; 26 coronal slice locations with 3 mm thickness and 0 mm skip; and matrix, 512 × 256 (yielding spatial resolution of .39 × .78 mm). The intrinsic (ie, transverse, vertical, superior and inferior longitudinal) and extrinsic (ie, genioglossus and interdigitated styloglossus and hyoglossus) tongue muscles were manually outlined on each slice of the full series of coronal tongue images using Amira (Visage Imaging GmbH, Berlin, Germany). The slice area was multiplied by the slice thickness to render slice volumes, and total lingual volume was acquired from the summated data.18,25
Quality of life
The SWAL-QOL, a dysphagia-specific quality of life questionnaire, consists of 11 subscales regarding swallowing-related concepts.26-28
Diet record
A dietary intake questionnaire, adapted from List et al29 and the Health Habits and History Questionnaire,30 and diet record were utilized to monitor oral intake. The diet record included self-report of weight changes in the preceding 3 months. The patient also was encouraged to supply a self-report of any diet changes during the intervention, detraining, and maintenance periods.
Pharyngoesophageal pressures
Pharyngoesophageal pressures associated with swallowing were measured with high-resolution manometry (HRM; ManoScan360 High-Resolution Manometry System, Sierra Scientific Instruments, Los Angeles, CA, USA). A 2.5-mm diameter, solid-state, high-resolution pressure catheter with 36 circumferential pressure sensors spaced 1 cm apart was placed transnasally, through the hypopharynx, and into the proximal esophagus. Pressure was measured in mm Hg with a fidelity of 2 mm Hg at 100 Hz. Topical 2% viscous lidocaine hydrochloride was applied to the nasal passages and catheter for comfort and ease of catheter placement. Bolus consistencies were provided as described previously. A customized MATLAB program (MathWorks, Inc., Natick, MA, USA) was used to extract pressure and timing data in areas of interest (velum, tongue base, and UES).31 Parameters of interest were maximum pressure and duration of pressure above or below baseline. HRM spatiotemporal plots were qualitatively analyzed by the third or fourth authors (C.J. and T.McC.). Figure 2 demonstrates a sample spatiotemporal pressure plot of a typical swallow.
Figure 2.
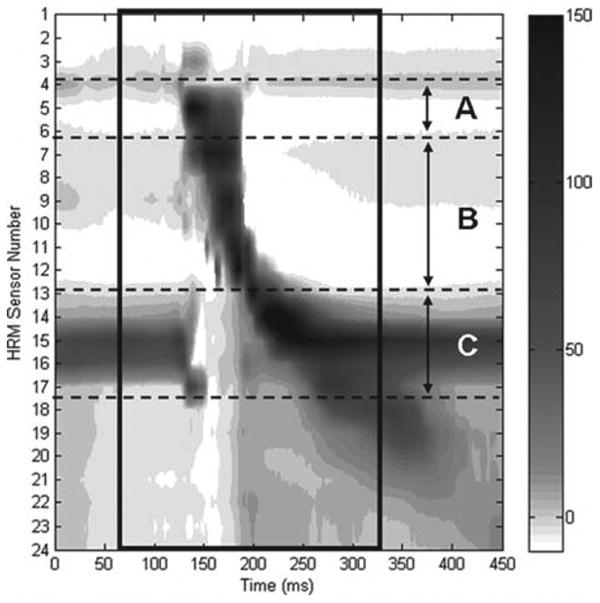
High-resolution manometry plot of typical swallow pressure pattern for a 5 mL liquid bolus swallow. (A) Nasopharyngeal region; (B) tongue base and hypopharyngeal region; (C) upper esophageal sphincter region. Pharyngeal swallow is outlined with black box. Darker grey and black tones correspond to higher pressures.
Evaluation
Each assessment, with the exception of high-resolution pharyngeal manometry, was scored by a single, trained speech-pathologist reviewer (J.J.). The reviewer was blinded to time during the treatment course, for each individual assessment, with the exception of diagnostics administered only at baseline (ie, MoCA). With respect to the videofl uroscopic swallow studies, the reviewer measured and rated individual components according to a previously described protocol.11
Statistical analysis
Graphical analysis was used to evaluate changes in isometric pressures measured using the MOST device, swallowing pressures measured using the 3-bulb array, and bolus flow kinematics associated with 8-week I-PRO therapy. A paired Student's t test with a Bonferroni-adjusted α criterion of 0.005 was used to compare pressure maximums and timing in the nasopharyngeal, hypopharyngeal, and UES regions. Where assumptions for t tests were not met, a Wilcoxon signed rank test was used.
Results
This section will focus specifically on the most apparent changes, across primary and secondary outcome measures, from baseline of the I-PRO intervention through the maintenance period. However, all results are available in the following figures and tables.
Lingual pressures
Maximum isometric lingual pressures
Maximum pressures from a sustained 3-second press at the anterior tongue increased from 33 kPa to 49 kPa, the posterior tongue increased from 23 kPa to 39 kPa, the right tongue increased from 12 kPa to 23 kPa, and the left tongue increased from 18 kPa to 22 kPa (Figure 3). Initially, the whole tongue press task of maintaining sustained pressure against all 5 sensors was highly variable for the 3-second press task, with composite pressures generated across 3 trials ranging from 11 kPa to 20 kPa at baseline. After 8 weeks, pressures became consistent across 3 trials, all at 15 kPa. Figures 4a and 4b show improved pressure generation stability of the whole tongue press across 3 trials pre and post intervention. Most notable changes occurred in the anterior and posterior sensors, which were the focus of the MOST-facilitated I-PRO therapy.
Figure 3.
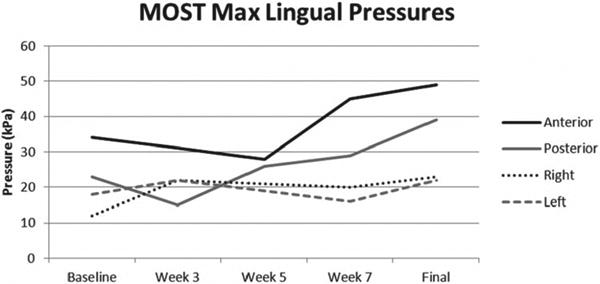
Maximum isometric lingual pressures across intervention.
Figure 4.
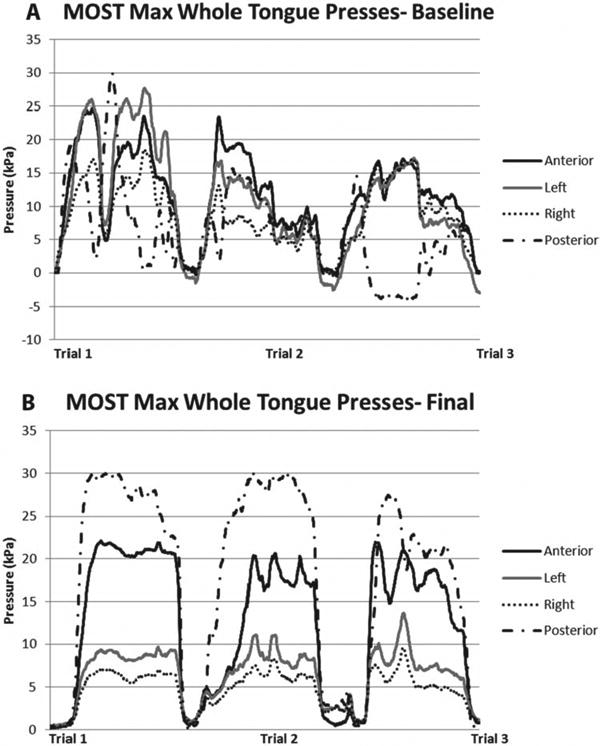
(A)Three trials of a whole tongue press, where the tongue presses against all sensors simultaneously, at baseline of I-PRO intervention. (B) Three trials of a whole tongue press at the end of I-PRO intervention.
Maximum lingual pressures during swallowing
Data for maximum lingual pressure peaks during swallowing were analyzed for each midsaggital sensor (#1, anterior; #2, mid; #3, posterior), with each bolus condition. Mean of the lingual pressure peaks for bulbs #1 and #2 rose from baseline to week 8 and declined from bulb #3 from baseline to week 8 (Figure 5).
Figure 5.
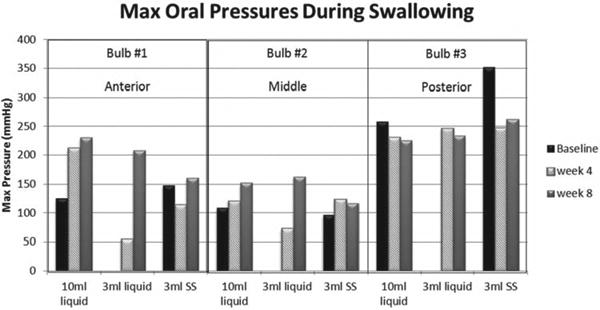
Maximum oral pressures during swallowing tasks increased for bulbs #1 and #2 from baseline to week 8 and declined for bulb #3 from baseline to week 8. The 3 mL liquid and cup liquid swallow data are missing at baseline due to anterior loss of bolus out of the mouth. SS = semisolid.
Bolus flow kinematics
Direction
At the baseline videofluoroscopic swallow study, J.B. required postural strategies of a tight right head turn combined with a chin tuck to safely pass any portion of the bolus through the UES. During the week 4 videofluoroscopic swallow study, she required only a chin tuck to safely pass approximately half of the bolus through the UES. However, UES opening remained both brief and narrow during both of those swallow studies, with residue in the pharynx post swallow. By the end of the 8-week period of I-PRO therapy, J.B. could swallow in the head neutral position and clear stasis using a head turn on a single repeat swallow of the same bolus. Aspiration occurred during the swallow at baseline and before the swallow at week 4 of the intervention period due to loss of bolus control. No aspiration occurred at the end of I-PRO intervention. Figure 6 demonstrates changes in Penetration-Aspiration Scale scores.
Figure 6.
Visual analysis of change in Penetration-Aspiration Scale scores across I-PRO intervention and maintenance periods. Detraining data are unavailable for analysis.
Duration
Oral clearance duration lengthened (Table 2), particularly for the larger volume thin liquid boluses and the semisolid boluses. Notably, duration of the cricopharyngeal opening during the swallow increased for the semisolid bolus. The time between beginning of laryngeal vestibule closure and the point where the leading edge of the bolus entered the pharynx decreased for the smaller thin liquid boluses. Stage transition duration decreased for the smallest thin liquid bolus and semisolid boluses. Figure 7 demonstrates durational changes.
Table 2. Bolus flow durations and timing measures over the I-PRO intervention and maintenance periods.
| Visit | Bolus type | OTC | OCD | STD | PTD | PCD | PRD | DOHME | DOHMAE | DTCPO | DOCPO | TSD | LVC | BLVC-HEP | BLVC-HME | DOCPO/PRD |
|---|---|---|---|---|---|---|---|---|---|---|---|---|---|---|---|---|
| Baseline | 3 mL liquid | 0.533 | 1.067 | 0.4 | 1.067 | 1.2 | 1.467 | 0.666 | 0.534 | 1.467 | 0.4 | 2.4 | 0.801 | 0.8 | 0.4 | 27% |
| Baseline | 3 mL liquid | 0.266 | 0.533 | −0.266 | 0.4 | 0.934 | 1.6 | 0.801 | 0.667 | 0.666 | 0.934 | 1.6 | 0.8 | 0.134 | 0.4 | 58% |
| Baseline | 3 mL liquid | 0.267 | 0.667 | −0.133 | 0.534 | 0.934 | 1.734 | 0.667 | 0.666 | 0.801 | 0.8 | 1.868 | 0.666 | 0.534 | 0.667 | 46% |
| Baseline | 10 mL liquid | 0.267 | 0.667 | −0.133 | 0.533 | 0.667 | 1.6 | 0.8 | 0.534 | 0.8 | 0.667 | 1.734 | 1.2 | 0 | 0.133 | 42% |
| Baseline | 10 mL liquid | 1.175 | 1.101 | −0.308 | 0.026 | 0.226 | 1.234 | 0.5 | 0.4 | 1.134 | 0.767 | 2.101 | 0.334 | −0.508 | −0.2 | 62% |
| Baseline | 10 mL liquid | 0.4 | 0.801 | −0.166 | 0.367 | 0.601 | 1.433 | 0.633 | 0.634 | 0.734 | 0.7 | 1.667 | 0.733 | 0.301 | 0.467 | 49% |
| Baseline | 3 mL SS | 0.167 | 0.267 | 0 | 0.467 | 0.7 | 1.033 | 0.6 | 0.333 | 0.467 | 0.567 | 1.2 | 0.534 | 0.233 | 0.233 | 55% |
| Baseline | 3 mL SS | 0.567 | 1.533 | −0.034 | 1 | 1.267 | 0.466 | 0.167 | 1.333 | 0.334 | 1.8 | 0.534 | 0.466 | 0.5 | 26% | |
| Baseline | 3 mL SS | 0.833 | 2.134 | −0.2 | 1.101 | 1.968 | 0.4 | 0.3 | 1.634 | 0.633 | 2.601 | 0.633 | 0.634 | 0.834 | 32% | |
| Baseline | Cup liquid | 0.734 | 0.9 | −0.234 | 0.4 | 0.8 | 1.334 | 0.6 | 0.667 | 1.034 | 1.5 | 1.834 | 0.833 | 0.033 | 0.267 | 112% |
| Week 4 | 3 mL liquid | 0.166 | 0.5 | −0.166 | 0.801 | 0.968 | 1.601 | 1.202 | 0.568 | 0.8 | 0.468 | 1.601 | 0.801 | 0.401 | 0.567 | 29% |
| Week 4 | 3 mL liquid | 0.133 | 0.534 | −0.067 | 0.567 | 0.801 | 1.435 | 0.734 | 0.634 | 0.7 | 0.634 | 1.501 | 1.101 | 0.1 | 0.167 | 44% |
| Week 4 | 3 mL liquid | 0.233 | 0.467 | −0.233 | 0.301 | 0.401 | 1.335 | 0.334 | 0.233 | 0.467 | 0.567 | 1.335 | 1.101 | −0.166 | 0.067 | 42% |
| Week 4 | 3 mL liquid | 0.667 | 0.901 | −0.344 | 0.3 | 0.634 | 1.502 | 0.634 | 0.534 | 0.967 | 0.701 | 1.835 | 0.735 | 0.133 | 0.467 | 47% |
| Week 4 | 10 mL liquid | 0.634 | 1.101 | 0.066 | 0.467 | 0.7 | 1.202 | 0.1 | 0.334 | 1.101 | 0.634 | 1.902 | 0.567 | 0.467 | 0.401 | 53% |
| Week 4 | 10 mL liquid | 0.634 | 0.967 | −0.301 | 0.333 | 0.634 | 1.435 | 0.133 | 0.567 | 0.967 | 0.634 | 1.768 | 0.534 | 0.267 | 0.568 | 44% |
| Week 4 | 10 mL liquid | 0.668 | 1.168 | −0.401 | 0.433 | 0.734 | 1.702 | 0.568 | 0.634 | 1.101 | 0.701 | 1.969 | 0.834 | −0.334 | 0.067 | 41% |
| Week 4 | 3 mL SS | 0.868 | 1.168 | −0.634 | 0.7 | 0.8 | 1.835 | 1.101 | 0.367 | 1.268 | 0.534 | 2.069 | 0.801 | 0.066 | 0.7 | 29% |
| Week 4 | 3 mL SS | 0.567 | 1.067 | −0.234 | 0.734 | 1.134 | 1.502 | 0.634 | 0.467 | 1.134 | 0.634 | 1.835 | 0.8 | 0.334 | 0.568 | 42% |
| Week 4 | 3 mL SS | 0.634 | 1.201 | −0.3 | 1.201 | 1.701 | 0.568 | 0.668 | 1.435 | 0.6 | 2.035 | 0.7 | 0.501 | 0.801 | 35% | |
| Week 4 | Cup liquid | 0.301 | 0.868 | −0.167 | 0.4 | 0.734 | 1.435 | 0.467 | 0.234 | 0.701 | 0.701 | 1.569 | 1.001 | 0.1 | 0.267 | 49% |
| Week 8 | 3 mL liquid | 0.333 | 1.134 | 0 | 0.968 | 1.135 | 1.535 | 0.467 | 0.333 | 1.268 | 0.433 | 1.868 | 0.567 | 0.801 | 0.801 | 28% |
| Week 8 | 3 mL liquid | 0.801 | 1.268 | −0.401 | 0.467 | 0.867 | 1.568 | 0.901 | 0.568 | 1.268 | 0.634 | 1.968 | 0.467 | 0.3 | 0.701 | 40% |
| Week 8 | 3 mL liquid | 0.601 | 1.001 | −0.501 | 0.233 | 0.734 | 1.635 | 0.568 | 0.634 | 0.834 | 0.734 | 1.735 | 0.634 | 0.167 | 0.768 | 45% |
| Week 8 | 10 mL liquid | 0.501 | 1.034 | −0.101 | 0.4 | 0.7 | 1.268 | 0.634 | 0.501 | 0.901 | 0.634 | 1.668 | −.867 | 0 | 0.101 | 50% |
| Week 8 | 10 mL liquid | 0.534 | 1.101 | −0.534 | 0.401 | 0.801 | 1.669 | 0.634 | 0.467 | 0.935 | 0.567 | 1.669 | 0.534 | 0.267 | 0.801 | 34% |
| Week 8 | 10 mL liquid | 0.3 | 0.934 | 0 | 0.501 | 0.968 | 1.202 | 0.5 | 0.467 | 0.701 | 0.734 | 1.502 | 0.868 | 0.1 | 0.1 | 61% |
| Week 8 | 3 mL SS | 0.568 | 1.769 | −0.301 | 0.967 | 1.735 | 0.801 | 0.467 | 1.302 | 0.534 | 2.002 | 0.801 | 0.4 | 1.501 | 31% | |
| Week 8 | 3 mL SS | 0.8 | 3.003 | −0.333 | 2.336 | 2.603 | 3.403 | 0.567 | 0.468 | 3.003 | 0.767 | 3.87 | 0.801 | 1.869 | 2.202 | 23% |
| Week 8 | 3 mL SS | 0.134 | 2.937 | −0.067 | 3.337 | 0.534 | 0.167 | 3.27 | 0.067 | 3.404 | 0.734 | 2.402 | 2.469 | 2% | ||
| Week 8 | Cup liquid | 0.167 | 0.668 | −0.234 | 0.501 | 0.734 | 0.901 | 0.701 | 0.634 | 0.568 | 0.634 | 1.302 | 0.935 | 0.1 | 0.333 | 70% |
| Maintenance | 3 mL thin | 0.768 | 0.968 | 0.2 | 0.534 | 0.767 | 1.501 | 0.667 | 0.2 | 1.302 | 0.533 | 2.469 | 0 | −13.514 | −13.714 | 36% |
| Maintenance | 3 mL thin | 0.634 | 1.034 | 0.4 | 0.567 | 1.101 | 1.168 | 0.701 | 0.167 | 1.201 | 0.734 | 2.202 | 0.834 | 0.434 | 0.034 | 63% |
| Maintenance | 3 mL thin | 0.734 | 1.001 | 0.267 | 0.501 | 0.734 | 1.001 | 0.6 | 0.367 | 1.235 | 0.534 | 2.002 | 0 | −52.853 | −53.12 | 53% |
| Maintenance | 10 mL thin | 0.067 | 0.367 | 0.133 | 0.3 | 0.634 | 0.901 | 0.501 | 0.5 | 0.267 | 0.668 | 1.101 | 0.701 | 0.2 | 0.067 | 74% |
| Maintenance | 10 mL thin | 0.468 | 0.768 | 0.166 | 0.367 | 0.533 | 1.035 | 0.667 | 0.701 | 0.768 | 0.634 | 1.669 | 0.801 | 0.2 | 0.034 | 61% |
| Maintenance | 3 mL SS | 0.801 | 0.901 | 0.066 | 0.433 | 0.7 | 1.035 | 0.701 | 0.601 | 1.034 | 0.634 | 1.902 | 0.768 | 0.133 | 0.067 | 61% |
Note: Detraining period data are unavailable for measurement. BLVC-HEP = beginning of LVC and when bolus head enters pharynx; BLVC-MHE = beginning for LVC and beginning of maximum hyoid elevation; DOHMAE = duration of hyoid maximum anterior excursion; DOHME = duration of hyoid maximum elevation; DTCPO = duration to LIES opening; LVC = laryngeal vestibule closure; OCT = oral clearance duration; OTD = oral transit duration; PCD = pharyngeal clearance duration; PRD = pharyngeal response duration; PTD = pharyngeal transit duration; SS = semisolid; STD = stage transition duration; TSD = total swallowing duration; LIES = upper esophageal sphincter.
Figure 7.
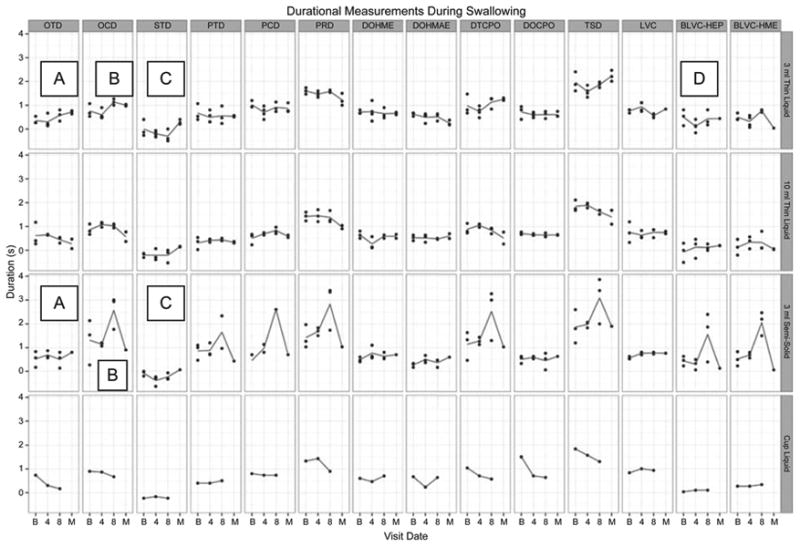
Visual analysis of change in durational measures across I-PRO intervention and maintenance periods. Lines represent mean values. Detraining period data are unavailable for analysis. A and B denote increases in oral transit and clearance durations, respectively, for 3 mL thin liquid and 3 mL semisolid boluses. C denotes a decrease in stage transition duration for the same boluses. D denotes a decrease between the beginning of laryngeal vestibule closure and the point when the bolus enters the pharynx for 3 mL thin liquid boluses.
Residue
There was decreased residue in the valleculae, along the posterior pharyngeal wall, and increased cricopharyngeal residue (Table 3) for semisolid boluses. Figure 8 demonstrates changes in residue across the I-PRO intervention and maintenance periods.
Table 3. Residue and Penetration-Aspiration (Pen-Asp) scores over the I-PRO intervention and maintenance periods.
| Visit | Bolus type | Oral cavity | Valleculae | Post pharyngeal wall | Pyriform sinus | Cricopharyngeus | Pen-Asp score |
|---|---|---|---|---|---|---|---|
| Baseline | 3 mL liquid | 1 | 1 | 1 | 2 | 0 | 2 |
| Baseline | 3 mL liquid | 1 | 1 | 1 | 2 | 1 | 1 |
| Baseline | 3 mL liquid | 1 | 1 | 1 | 2 | 1 | 2 |
| Baseline | 10 mL liquid | 1 | 1 | 0 | 2 | 1 | 2 |
| Baseline | 10 mL liquid | 1 | 1 | 1 | 2 | 1 | 5 |
| Baseline | 10 mL liquid | 1 | 1 | 1 | 2 | 1 | 1 |
| Baseline | 3 mL SS | 0 | 2 | 1 | 2 | 1 | 1 |
| Baseline | 3 mL SS | 0 | 2 | 2 | 2 | 1 | 1 |
| Baseline | 3 mL SS | 2 | 2 | 2 | 2 | 0 | 1 |
| Baseline | Cup liquid | 0 | 1 | 1 | 2 | 1 | 1 |
| Week 4 | 3 mL liquid | 1 | 1 | 0 | 1 | 1 | 3 |
| Week 4 | 3 mL liquid | 0 | 1 | 1 | 1 | 1 | 3 |
| Week 4 | 3 mL liquid | 1 | 1 | 1 | 1 | 1 | 1 |
| Week 4 | 3 mL liquid | 0 | 1 | 0 | 2 | 1 | 1 |
| Week 4 | 10 mL liquid | 0 | 1 | 1 | 1 | 0 | 2 |
| Week 4 | 10 mL liquid | 0 | 1 | 0 | 1 | 1 | 2 |
| Week 4 | 10 mL liquid | 0 | 1 | 1 | 2 | 1 | 2 |
| Week 4 | 3 mL SS | 1 | 1 | 1 | 2 | 1 | 2 |
| Week 4 | 3 mL SS | 1 | 0 | 2 | 2 | 2 | 1 |
| Week 4 | 3 mL SS | 1 | 1 | 2 | 2 | 2 | 1 |
| Week 4 | Cup liquid | 1 | 1 | 0 | 1 | 2 | 2 |
| Week 8 | 3 mL liquid | 1 | 1 | 0 | 2 | 2 | 1 |
| Week 8 | 3 mL liquid | 1 | 1 | 0 | 1 | 2 | 1 |
| Week 8 | 3 mL liquid | 1 | 1 | 0 | 2 | 2 | 3 |
| Week 8 | 10 mL liquid | 1 | 1 | 0 | 1 | 1 | 3 |
| Week 8 | 10 mL liquid | 1 | 1 | 0 | 2 | 2 | 2 |
| Week 8 | 10 mL liquid | 1 | 2 | 0 | 2 | 2 | 2 |
| Week 8 | 3 mL SS | 1 | 1 | 2 | 2 | 1 | 1 |
| Week 8 | 3 mL SS | 2 | 0 | 2 | 2 | 2 | 1 |
| Week 8 | 3 mL SS | 2 | 0 | 2 | 2 | 2 | 1 |
| Week 8 | Cup liquid | 1 | 1 | 1 | 1 | 1 | 1 |
| Maintenance | 3 mL thin | 1 | 1 | 1 | 2 | 0 | 1 |
| Maintenance | 3 mL thin | 1 | 1 | 1 | 2 | 2 | 3 |
| Maintenance | 3 mL thin | 1 | 0 | 0 | 2 | 2 | 1 |
| Maintenance | 10 mL thin | 1 | 2 | 0 | 2 | 2 | 5 |
| Maintenance | 10 mL thin | 0 | 1 | 0 | 2 | 2 | 1 |
| Maintenance | 3 mL SS | 1 | 0 | 1 | 2 | 2 | 1 |
Note : Detraining period data are unavailable for measurement.
Figure 8.
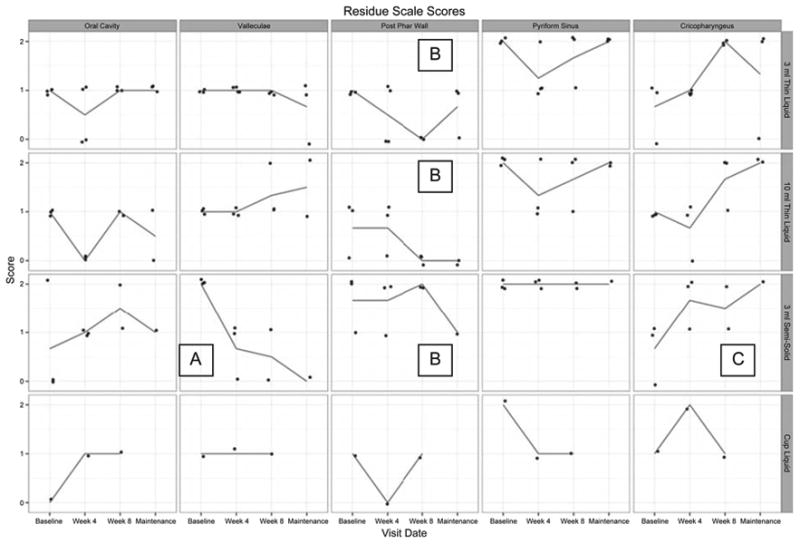
Visual analysis of change in residue scores across I-PRO intervention and maintenance periods. Lines represent mean values. Detraining data are unavailable for analysis. In the 3 mL and 10 mL thin liquid rows, B denotes an overall decrease in residue along the posterior pharyngeal wall. In the 3 mL semisolid row, A, B, and C denote overall decreases in residue in the valleculae and along the posterior pharyngeal wall and an increase in cricopharyngeal residue, respectively.
Lingual volume
Lingual volume increased by 8.37% from 57.44 cm3 at baseline to 62.25 cm3 at week 8.
Quality of life
SWAL-QOL results indicated improvement in 10 of 11 QOL subscales (Figure 9).
Figure 9.
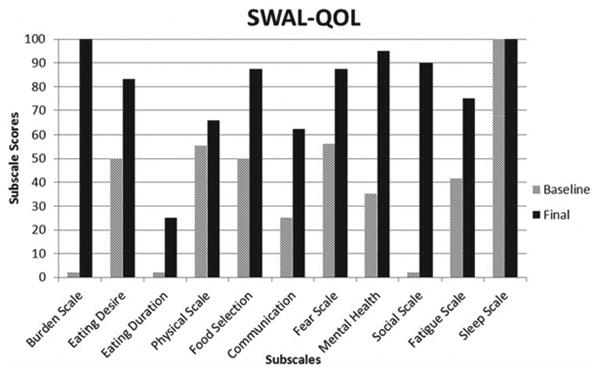
Change in dysphagia-specific quality of life subscales pre to post I-PRO intervention.
Diet record
J.B.'s diet progressed from total dependence on the gastrostomy tube (G-tube) at baseline, with minimal oral intake, to an unrestricted diet at the end of I-PRO therapy. G-tube use was completely discontinued, but not removed, and medication was taken whole with thin liquids or puree post intervention. She successfully managed her secretions by swallowing, rather than expectorating. She also reported a change in food and liquid temperature tolerance, with the ability to eat and drink both warm and hot items, with generally heightened sensitivity during a swallow.
J.B. reported gains in confidence to eat or drink in any type of social situation, whereas for the more than 2-year-long preintervention period she avoided social gatherings that highlighted food or drink. Based on objective findings from the videofluoroscopic swallow studies at baseline and week 4, the clinical decision was made for J.B. to initiate oral intake. Midway through the intervention, she reported feeling hunger for the first time since the onset of her dysphagia. She reported more ease during oral intake, thereby increasing her motivation to increase oral intake and venture into social activities that highlight food and drink. J.B. gained approximately 15 lbs, eating orally, over the 8-week intervention.
Detraining and Maintenance
During the 5-week detraining period subsequent to the 8-week I-PRO period, J.B. reported the sensation that her UES was tightening and, she sensed, minimizing bolus flow through to the esophagus. Fluoroscopic and oral manometric evaluation of swallowing, after 5 weeks of detraining, showed an overall slight decrease in maximum oral pressures, increase in pharyngeal stasis, and narrowed UES opening during the swallow compared to the postintervention swallow study. Fluoroscopic durational measures are unavailable due to visual artifact obscuring critical views of the oral cavity, hyoid, and laryngeal vestibule. Maximum isometric pressures demonstrated some decline with the anterior tongue at 44 kPa and the posterior tongue at 34 kPa, compared to 49 kPa and 39 kPa, respectively, at the end of intervention. A once weekly I-PRO maintenance program was initiated and a referral was made for possible repeat dilatation of the UES. After 9 weeks of maintenance, findings revealed maintenance of maximum isometric oral pressures for the anterior tongue at 44 kPa and decline in pressures for the posterior tongue at 23 kPa, compared to 49 kPa and 39 kPa, respectively, at the end of intervention. Figure 10 demonstrates changes in maximum isometric lingual pressures for the anterior and posterior tongue across the intervention, detraining, and maintenance periods. Fluoroscopic evaluation of swallowing, after 9 weeks of maintenance therapy, showed safe propulsion of the bolus through the hypopharynx and UES using either a chin tuck or right head turn. Aspiration occurred once when the patient used neither postural strategy of a chin tuck nor a right head turn. Other clinically significant findings include maintenance of improved dysphagia-specific QOL scores noted at the end of intervention and stable weight reported at 125 lbs. J.B. continued to eat a regular diet and did not need an alternative means of nutrition.
Figure 10.
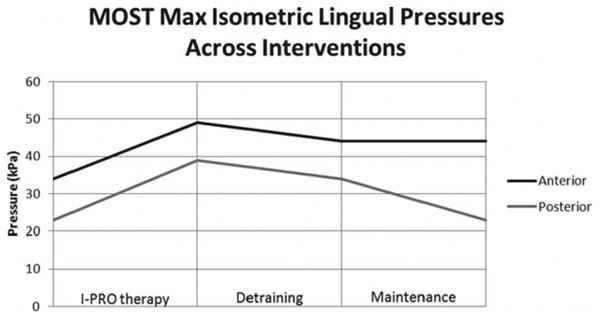
Change in maximum isometric lingual pressures across intervention periods.
Pharyngoesophageal pressures
Spatiotemporal pressure plots of pharyngeal and esophageal pressures taken before I-PRO training and during detraining can be found in Figure 11. Qualitative observation reveals a change in pressure patterns pre and post therapy, with globally abnormal pressure patterns when compared to a typical swallow (Figure 2). Pressure and duration measurements collected before and after I-PRO therapy, along with normative values,31 can be found in Table 4. After completion of I-PRO therapy, the only significant difference observed was a decrease in minimum pressure during UES opening (P < .01).
Figure 11.
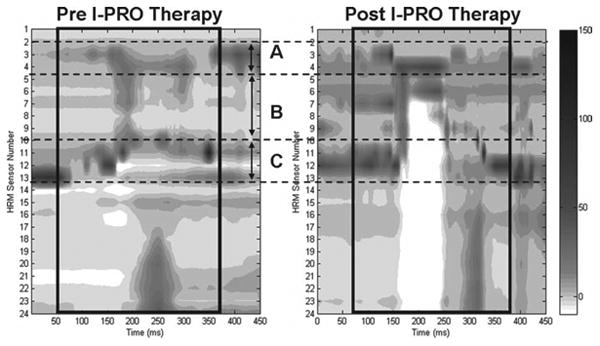
High-resolution manometry plot of a representative swallow pressure pattern from J.B. with a 5 mL liquid bolus swallow. (A) Nasopharyngeal region; (B) tongue base and hypopharyngeal region; (C) upper esophageal sphincter region. Pharyngeal swallow is outlined with a black box. Darker grey and black tones correspond to higher pressures.
Table 4. Pressure and duration measurements collected before and after I-PRO therapy, along with normative values.
| Measure | Pre I-PRO therapy | Post I-PRO therapy | P value | Normative values26 |
|---|---|---|---|---|
| NP max, mm Hg | 69 (24) | 65 (8) | .73 | 154 (42) |
| NP duration, s | 0.53 (0.22) | 0.96 (.04) | .04 | 0.84 (0.21) |
| HP max, mm Hg | 33 (11) | 63 (8) | .02 | 307 (172) |
| HP duration, s | 0.58 (0.33) | 1.03 (0.19) | .73 | 0.58 (0.17) |
| UES pre-nadir max, mm Hg | 105 (15) | 87 (33) | .31 | 226 (115) |
| UES post-nadir max, mm Hg | 107 (29) | 92 (21) | .40 | 318 (135) |
| UES nadir, mm Hg | -4 (2) | -18 (5) | <.01* | -4 (7) |
| UES activity time, s | 1.46 (0.64) | 1.42 (0.23) | .81 | 0.94 (0.18) |
| Total swallow time, s | 1.79 (0.54) | 1.74 (0.28) | .86 | 0.89 (0.13) |
Note : Values given as mean (SD). UES activity time is defined as time between pre-nadir and post-nadir peak pressures.
HP = hypopharynx; NP = nasopharynx; UES = upper esophageal sphincter.
Significant P values against the Bonferroni correction.
Discussion
Device-facilitated I-PRO therapy transitioned a single patient, who was more than 2 years post brainstem stroke, with profound dysphagia to functional swallowing. The patient received nutrition and hydration solely by G-tube and could manage secretions only by expectoration when I-PRO intervention was initiated. Other treatments, such as UES dilatation, were performed post maintenance to demonstrate that changes observed at the end of the intervention period resulted primarily from the MOST-facilitated I-PRO intervention. The oropharyngeal swallow is a complex, multifaceted function comprising the combined effort of multiple muscles, end organs, and 5 cranial nerves. In this case study, several of these separate end organs, including the tongue, pharyngeal constrictors, and cricopharyngeus, undergo change via a simple, nonspecific task focusing the patient on a single organ, the tongue (including intrinsic and extrinsic muscles). Although the tongue is the primary applicator of force to drive a bolus through the oral and pharyngeal spaces, it is not the only driving force. The base of tongue and pharyngeal wall constrictors apply pressure on all sides of the bolus to propel it through the hypopharynx and UES. Positive and negative changes observed in swallowing-related outcomes, including postswallow residue score, kinematic durations, and pharyngeal pressures, reflect this complex anatomic-physiologic process.
The goal in application of the novel MOST device, with a patient more than 2 years post brainstem stroke, was a return to functional swallowing compared with normal or premorbid swallowing abilities. Clinical significance, as it relates to this goal, was the primary concern for this patient. In similar chronic cases, the goals are typically a return to function, which is more important to the patient in regard to improvements in QOL than statistical measures of change.
In isolation, the increase in semisolid cricopharyngeal residue post I-PRO intervention may seem unhelpful at first glance, in terms of bolus clearance. However, improved pharyngeal bolus clearance is apparent when viewed in light of the diminishing residue both in the valleculae and posteriorly along the pharyngeal wall and increased residue moving inferiorly through the pyriform sinuses to the cricopharyngeus, combined with greater pressure generation clearing material from the upper pharynx. By the end of intervention, a single, second swallow in head-turned position afforded the best clearance of pharyngeal residue; whereas pre intervention, J.B. required 4 to 5 swallows to minimize residue, which added a fatigue factor to swallowing. Changes observed in timing between initiation of airway protection (beginning of laryngeal vestibule closure) and the point where the bolus enters the pharynx (Table 1) further suggest that movements generated with increased pressure by the tongue musculature may affect associated structures innervated by different cranial nerves, centers, and/or pattern generators. In this case, the decrease in time between the beginning of laryngeal vestibule closure and the point when the bolus enters the pharynx is evidence of improved airway protection, as the laryngeal vestibule is closing nearer to the time that the bolus enters the pharynx. I-PRO therapy not only facilitated gains in swallow function, but also a change in lingual anatomy as well; there was an 8.37% increase in total tongue volume, indicative of a reversal in potential muscle atrophy.
Gains made in pharyngeal pressure patterns, though improved following I-PRO therapy, did not reach normative levels and did not return to a typical presentation as seen on the spatiotemporal plots (Figures 1 and 10). However, there was return to functional swallowing abilities. Notably, the minimum UES pressure dropped to levels below the normative data. It is possible that the patient developed a compensatory strategy to open the UES in the setting of relatively low hypopharyngeal pressures and hyolaryngeal excursion by using means other than those clinically measured. This gives new insight to oropharyngeal pressure patterns that are needed for a safe swallow, namely high hypopharyngeal pressures, that are evidently influenced by oral pressures in the setting of low UES pressures.
Clinically, the most significant outcomes from the patient's point of view are in the changes that affect daily life. This patient enthusiastically reported a complete return to premorbid activities post intervention. At baseline, this profound dysphagia was perceived as a complete burden, because all food and drink were restricted (Figure 8). Post intervention, there was no more perceived burden because diet was completely unrestricted. The patient's perception of restriction and resultant burden were directly related to her perception of enjoyment and motivation to participate in premorbid activities including any sort of food or drink.
A potential confounding factor was the initiation of oral intake during the intervention period, as the act of swallowing promotes swallowing. However, until week 4 of the intervention period, the patient was unable to safely take anything by mouth. The decision to initiate oral intake was clinically warranted by improvements in objective, radiographic, and instrumental findings comparing data collected at baseline to week 4 of the intervention period. This case study included the inconsistent design of an 8-week intervention, 5-week detraining period, 9-week therapeutic maintenance period, and it examined just one patient's participation in MOST-facilitated I-PRO strengthening therapy. The final UES dilatation, which occurred after the maintenance period, is also a potential confounding factor related to the patient's oral intake. However, the patient initiated oral intake 18 weeks before the dilatation and discontinued the use of her G-tube 14 weeks prior to the dilatation. Diet advancement did occur as a consequence of I-PRO intervention alone, however the UES dilatation further broadened the patient's diet advancement.
From the patient's perspective, QOL also improved as she was able to swallow her own saliva and no longer carried a spittoon; the latter was certainly a challenge for social acceptability. She also gained back 15 lbs, of her lost 25 lbs, by the end of the intervention; this weight gain was initially perceived as being unattainable. Perhaps most important, she expressed great surprise, satisfaction, and pleasure in her new oral intake status.
This patient, who was more than 2 years post stroke, made enormous gains in her ability to swallow her secretions and re-initiate oral intake without the risk of airway invasion, by virtue of increasing tongue strength and improving oral control using I-PRO therapy. Despite other previous and intensive traditional therapies performed in the 25 months prior to initiating I-PRO therapy, MOST-facilitated I-PRO therapy resulted in the greatest gains in terms of QOL. Additionally, the MOST device provided the patient immediate knowledge of performance and automatically recorded any and all lingual press repetition and pressure data each time J.B. used the device. This afforded improved reliability and patient compliance by eliminating more crude/less reliable recording and reporting methods such as daily logs or therapy journals.
The potential for improvement with I-PRO therapy hinges on fundamental principles of exercise,15 including repetition, overload, and therapy duration. At 8 weeks, this single patient continued to demonstrate improvements and may have continued to improve beyond the period of this study. However, the upper limit of I-PRO therapy duration is not well-defined. Further research is needed to determine the optimal I-PRO therapy regimen as well as various patient populations that could potentially benefit from this therapy.
Gains made using MOST-facilitated I-PRO therapy demonstrate an important argument for functionality as a goal for swallowing therapy. Even though the patient did not reach normal values for lingual or pharyngeal pressures following therapy, she was able to augment her swallowing pressure patterns to safely and enjoyably (ie, with reduced patient-perceived effort) swallow a bolus. Novel technologies and applications, such as the MOST device and high-resolution manometry, offer new solutions and documentation of methods for swallowing intervention and have the potential to quantify gains not previously achievable or detectable.
Acknowledgments
Financial support/disclosures: This article is the result of work supported by VA Merit Grant C4796R and resources at the Geriatric Research, Education, and Clinical Center (GRECC) in the William S. Middleton Memorial Veterans Hospital. This is GRECC manuscript #09. The senior author, Dr. Robbins, serves in a leadership position for Swallow Solutions, LLC, and is an equity holder.
Footnotes
Additional contributions: We thank Abby Duane, BS, for helping with manuscript preparation, resources, and support at the University of Wisconsin School of Medicine and Public Health (UW SMPH) and colleagues at the UW Hospital and Clinics for their contributions.
References
- 1.Martino R, Foley N, Bhogal S, Diamant N, Speechley M, Teasell R. Dysphagia after stroke: Incidence, diagnosis, and pulmonary complications. Stroke. 2005;36(12):2756–2763. doi: 10.1161/01.STR.0000190056.76543.eb. [DOI] [PubMed] [Google Scholar]
- 2.Daniels SK, Schroeder MF, McClain M, Corey DM, Rosenbek JC, Foundas AL. Dysphagia in stroke: Development of a standard method to examine swallowing recovery. J Rehabil Res Dev. 2006;43(3):347–356. doi: 10.1682/jrrd.2005.01.0024. [DOI] [PubMed] [Google Scholar]
- 3.Teasell R, Foley N, Fisher J, Finestone H. The incidence, management, and complications of dysphagia in patients with medullary strokes admitted to a rehabilitation unit. Dysphagia. 2002;17(2):115–120. doi: 10.1007/s00455-001-0110-8. [DOI] [PubMed] [Google Scholar]
- 4.Marik PE, Kaplan D. Aspiration pneumonia and dysphagia in the elderly. Chest. 2003;124(1):328–336. doi: 10.1378/chest.124.1.328. [DOI] [PubMed] [Google Scholar]
- 5.Pikus L, Levine MS, Yang YX, et al. Videofluoroscopic studies of swallowing dysfunction and the relative risk of pneumonia. Am J Roentgenol. 2003;180(6):1613–1616. doi: 10.2214/ajr.180.6.1801613. [DOI] [PubMed] [Google Scholar]
- 6.Ickenstein GW, Riecker A, Hohlig C, et al. Pneumonia and in-hospital mortality in the context of neurogenic oropharyngeal dysphagia (NOD) in stroke and a new NOD step-wise concept. J Neurol. 2010;257(9):1492–1499. doi: 10.1007/s00415-010-5558-8. [DOI] [PMC free article] [PubMed] [Google Scholar]
- 7.Tokunaga T, Kubo T, Ryan S, et al. Long-term outcome after placement of a percutaneous endoscopic gastrostomy tube. Geriatr Gerontol Int. 2008;8(1):19–23. doi: 10.1111/j.1447-0594.2008.00442.x. [DOI] [PubMed] [Google Scholar]
- 8.Han TR, Paik NJ, Park JW, Kwon BS. The prediction of persistent dysphagia beyond six months after stroke. Dysphagia. 2008;23(1):59–64. doi: 10.1007/s00455-007-9097-0. [DOI] [PubMed] [Google Scholar]
- 9.Palmer JB, Drennan JC, Baba M. Evaluation and treatment of swallowing impairments. Am Fam Physician. 2000;61(8):2453–2462. [PubMed] [Google Scholar]
- 10.Logemann JA, Pauloski BR, Rademaker AW, Colangelo LA. Super-supraglottic swallow in irradiated head and neck cancer patients. Head Neck. 1997;19(6):535–540. doi: 10.1002/(sici)1097-0347(199709)19:6<535::aid-hed11>3.0.co;2-4. [DOI] [PubMed] [Google Scholar]
- 11.Hind JA, Nicosia MA, Roecker EB, Carnes ML, Robbins J. Comparison of effortful and noneffortful swallows in healthy middle-aged and older adults. Arch Phys Med Rehabil. 2001;82(12):1661–1665. doi: 10.1053/apmr.2001.28006. [DOI] [PubMed] [Google Scholar]
- 12.Hewitt A, Hind J, Kays S, et al. Standardized instrument for lingual pressure measurement. Dysphagia. 2008;23(1):16–25. doi: 10.1007/s00455-007-9089-0. [DOI] [PubMed] [Google Scholar]
- 13.Banaszynski K, Hind J, Juan J, Robbins J. Isometric and swallowing lingual pressure generation at five tongue locations. Dysphagia Research Society; Toronto, Canada: 2012. [Google Scholar]
- 14.Clark HM, O'Brien K, Calleja A, Corrie SN. Effects of directional exercise on lingual strength. J Speech Lang Hear Res. 2009;52(4):1034–1047. doi: 10.1044/1092-4388(2009/08-0062). [DOI] [PubMed] [Google Scholar]
- 15.American College of Sports Medicine. The recommended quantity and quality of exercise for developing and maintaining cardiorespiratory and muscular fitness in healthy adults. Med Sci Sports Exerc. 1990;22(2):265–274. [PubMed] [Google Scholar]
- 16.Verschuren O, Ada L, Maltais DB, Gorter JW, Scianni A, Ketelaar M. Muscle strengthening in children and adolescents with spastic cerebral palsy: Considerations for future resistance training protocols. Phys Ther. 2011;91(7):1130–1139. doi: 10.2522/ptj.20100356. [DOI] [PubMed] [Google Scholar]
- 17.Lazarus C. Tongue strength and exercise in healthy individuals and in head and neck cancer patients. Semin Speech Lang. 2006;27(4):260–267. doi: 10.1055/s-2006-955116. [DOI] [PubMed] [Google Scholar]
- 18.Robbins J, Kays SA, Gangnon R, Hewitt A, Hind J. The effects of lingual exercise in stroke patients with dysphagia. Arch Phys Med Rehabil. 2007;88:150–158. doi: 10.1016/j.apmr.2006.11.002. [DOI] [PubMed] [Google Scholar]
- 19.Fiatarone MA, Marks EC, Ryan ND, Meredith CN, Lipsitz LA, Evans WJ. High-intensity strength training in nonagenarians. Effects on skeletal muscle. J Am Med Assoc. 1990;263(22):3029–3034. [PubMed] [Google Scholar]
- 20.Nasreddine ZS, Phillips NA, Bédirian V, et al. The Montreal Cognitive Assessment (MoCA): A brief screening tool for mild cognitive impairment. J Am Geriatr Soc. 2005;53(4):695–699. doi: 10.1111/j.1532-5415.2005.53221.x. [DOI] [PubMed] [Google Scholar]
- 21.Trappe S, Williamson D, Godard M. Maintenance of whole muscle strength and size following resistance training in older men. J Gerontol A Biol Sci Med Sci. 2002;57(4):B138–143. doi: 10.1093/gerona/57.4.b138. [DOI] [PubMed] [Google Scholar]
- 22.Peter J, McNair JD, Brettkelly M, Stanley SN. Verbal encouragement: Effects on maximum effort voluntary muscle action. Br J Sports Med. 1996;30(3):243–245. doi: 10.1136/bjsm.30.3.243. [DOI] [PMC free article] [PubMed] [Google Scholar]
- 23.Rosenbek JC, Robbins JA, Roecker EB, Coyle JL, Wood JL. A penetration-aspiration scale. Dysphagia. 1996;11(2):93–98. doi: 10.1007/BF00417897. [DOI] [PubMed] [Google Scholar]
- 24.Robbins J, Coyle J, Roecker E, Rosenbek J, Wood J. Differentiation of normal and abnormal airway protection during swallowing using the penetration-aspiration scale. Dysphagia. 1999;14(4):228–232. doi: 10.1007/PL00009610. [DOI] [PubMed] [Google Scholar]
- 25.Robbins JHJ, Sattin J, Malandraki G. Stroke, swallowing and recovery 2010: From rehabilitation to rewiring. Short Course American Speech Language and Hearing Association Convention; Philadelphia, PA: 2010. [Google Scholar]
- 26.McHorney C, Bricker D, Kramer A, et al. The SWAL-QOL outcomes tool for oropharyngeal dysphagia in adults: I. Conceptual foundation and item development. Dysphagia. 2000;15(3):115–121. doi: 10.1007/s004550010012. [DOI] [PubMed] [Google Scholar]
- 27.McHorney CA, Bricker DE, Robbins JA, Kramer AE, Rosenbek JC, Chignell KA. The SWAL-QOL outcomes tool for oropharyngeal dysphagia in adults: II. Item reduction and preliminary scaling. Dysphagia. 2000;15(3):122–133. doi: 10.1007/s004550010013. [DOI] [PubMed] [Google Scholar]
- 28.McHorney CA, Robbins JA, Lomax K, et al. The SWAL-QOL outcomes tool for oropharyngeal dysphagia in adults: III.Extensive evidence of reliability and validity. Dysphagia. 2002;17:97–114. doi: 10.1007/s00455-001-0109-1. [DOI] [PubMed] [Google Scholar]
- 29.List MA, Ritter-Sterr C, Lansky SB. A performance status scale for head and neck cancer patients. Cancer. 1990;66(3):564–569. doi: 10.1002/1097-0142(19900801)66:3<564::aid-cncr2820660326>3.0.co;2-d. [DOI] [PubMed] [Google Scholar]
- 30.Block G, Hartman AM, Naughton D. A reduced dietary questionnaire: Development and validation. Epidemiology. 1990;1(1):58–64. doi: 10.1097/00001648-199001000-00013. [DOI] [PubMed] [Google Scholar]
- 31.Mielens JD, Hoffman MR, Ciucci MR, Jiang JJ, McCulloch TM. Automated analysis of pharyngeal pressure data obtained with high-resolution manometry. Dysphagia. 2011;26(1):3–12. doi: 10.1007/s00455-010-9320-2. [DOI] [PMC free article] [PubMed] [Google Scholar]


