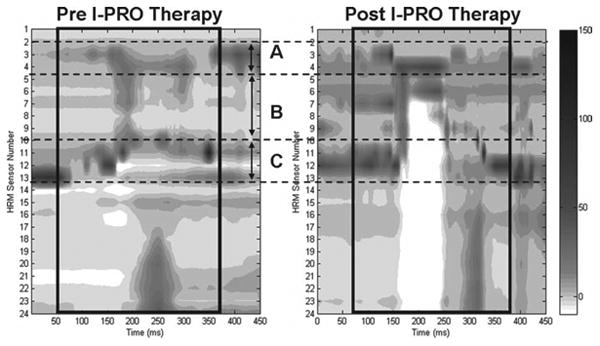
Figure 11.

High-resolution manometry plot of a representative swallow pressure pattern from J.B. with a 5 mL liquid bolus swallow. (A) Nasopharyngeal region; (B) tongue base and hypopharyngeal region; (C) upper esophageal sphincter region. Pharyngeal swallow is outlined with a black box. Darker grey and black tones correspond to higher pressures.
