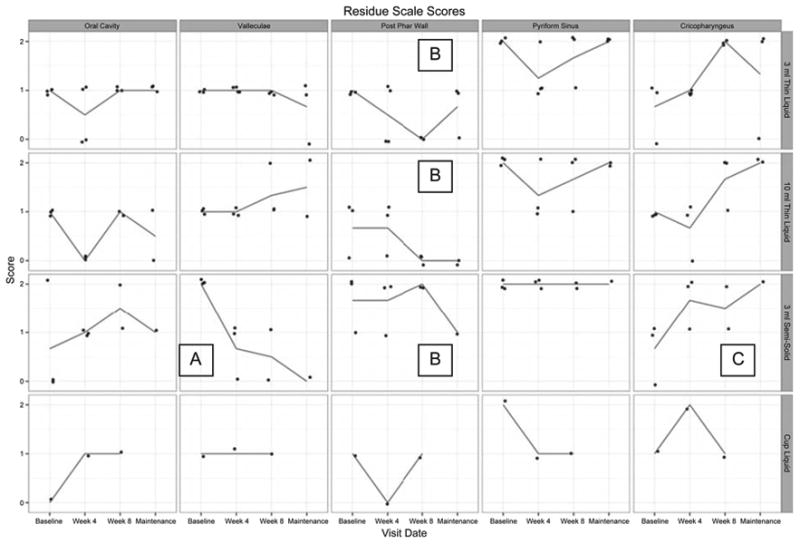
Figure 8.

Visual analysis of change in residue scores across I-PRO intervention and maintenance periods. Lines represent mean values. Detraining data are unavailable for analysis. In the 3 mL and 10 mL thin liquid rows, B denotes an overall decrease in residue along the posterior pharyngeal wall. In the 3 mL semisolid row, A, B, and C denote overall decreases in residue in the valleculae and along the posterior pharyngeal wall and an increase in cricopharyngeal residue, respectively.
