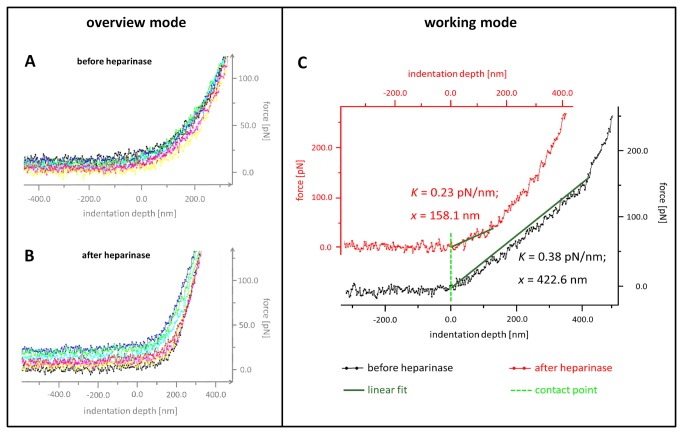
Figure 3. Original force indentation tracings before (A, C) and after (B, C) heparinase I treatment measured on ex vivo rat aortic samples by AFM.
(A, B) “Overview mode” showing 7 force indentation curves recorded from a single endothelial cell before and after heparinase I treatment, respectively. (C) Each force indentation curve was then analyzed separately using a higher magnification (“working mode”) which facilitates the determination of the thickness and the stiffness of the endothelial glycocalyx by linear approximation. Please note that values on X- and Y-axis in A and B are approximations for graphical illustration.

