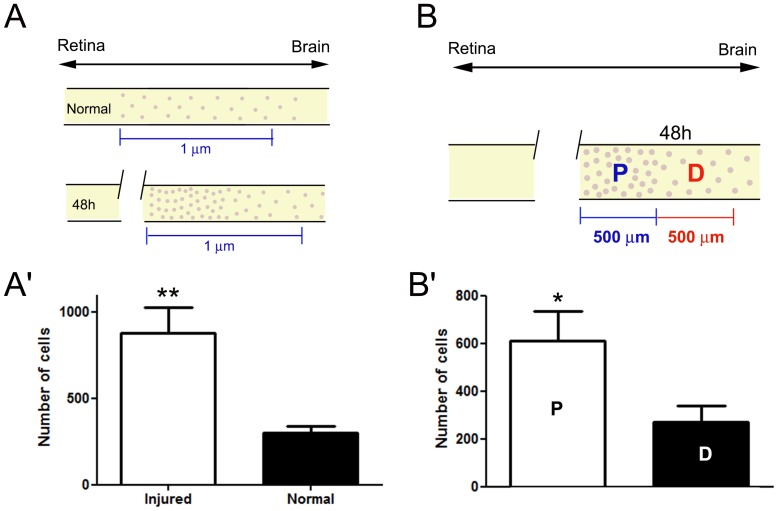
Figure 2. Density of cells in the PCT increases after injury.
(A) Schematic illustration of both normal and injured PCT showing the cellular arrangement along the tract, including the quantified area (1 µm). The anatomical position of the tract is represented by a double-sensed arrow on the top (retina – brain). (A′) 48 h after injury, the distal part of the tract had approximately three times as many cells as the control group. Student t test revealed a significant difference between the two groups (n = 5 crabs/group; p<0.005). (B) Schematic illustration of the injured tract divided into two regions (500 µm each): proximal (P) and distal (D) to the lesion. Most cells are grouped in the damaged area 500 µm from the injury. In contrast, region D maintains the same cellular density as seen in the control. (B′) Statistical analysis shows twice as many cells in region P as in D. Student t test revealed a significant difference between the two groups (n = 5 crabs/group; p<0.05). Asterisks denote significant differences between groups.

