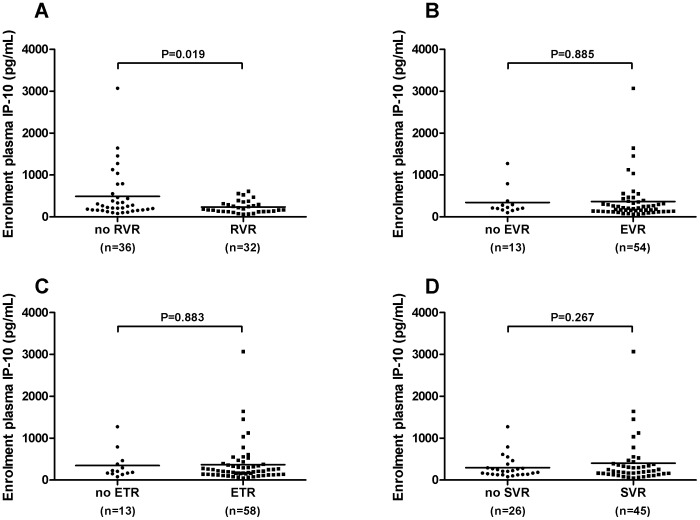
Figure 3. Baseline plasma IP-10 according to virological responses.
Baseline IP-10 values are shown in patients who did and did not achieve: a) RVR b) EVR c) ETR and d) SVR. Results are shown for the entire treated cohort. IP-10 levels were compared using the student’s t-test with Welch’s correction for unequal variances as appropriate. RVR rapid virological response; EVR early virological response; ETR end of treatment response; SVR sustained virological response.

