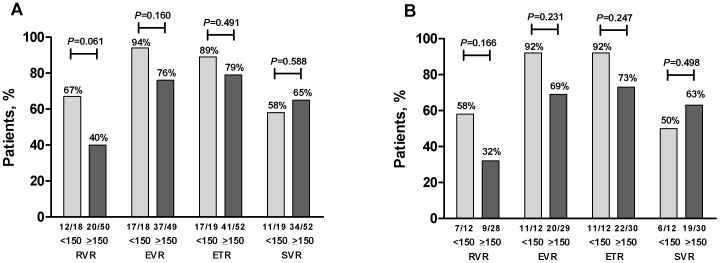
Figure 5. Response based on baseline IP-10 level above or below 150 pg/mL among adherent individuals.
The proportion of patients with baseline IP-10 levels above or below 150 pg/mL who achieved RVR, cEVR, ETR and SVR are shown for a) the whole cohort and b) patients with genotype 1 infection. Responses were compared using Fisher’s Exact Test.

