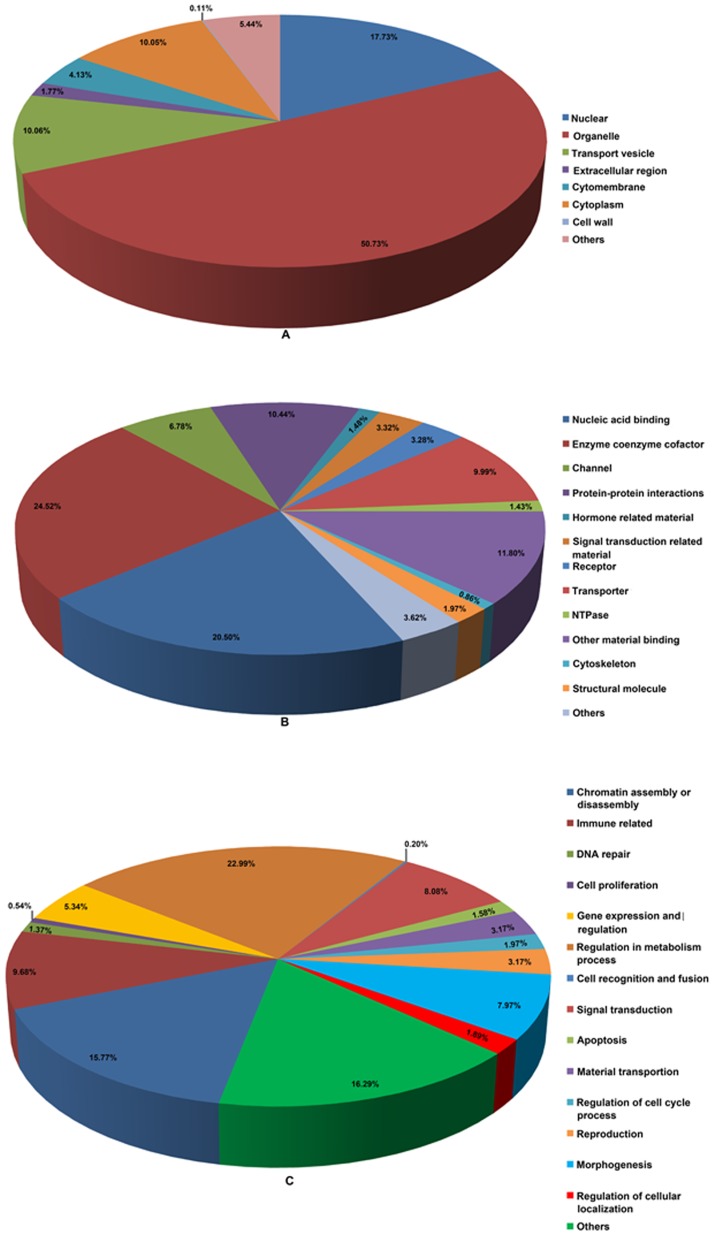
Figure 1. Categorization of the GO terms based on the differentially expressed genes.
Categorization of GO terms with a p-value greater than or equal to 1: cellular component terms (A), molecular function terms (B) and biological process terms (C). All of the differentially expressed genes were classified based on GO analysis. By this method all DEGs are firstly mapped to GO terms in the database (http://www.geneontology.org/), calculating gene numbers for every term, then using hypergeometric test to find significantly enriched GO terms in DEGs comparing to the genome background. Each category is labeled with different colors, and the numbers refer to ratio of these categories to the all dataset.

