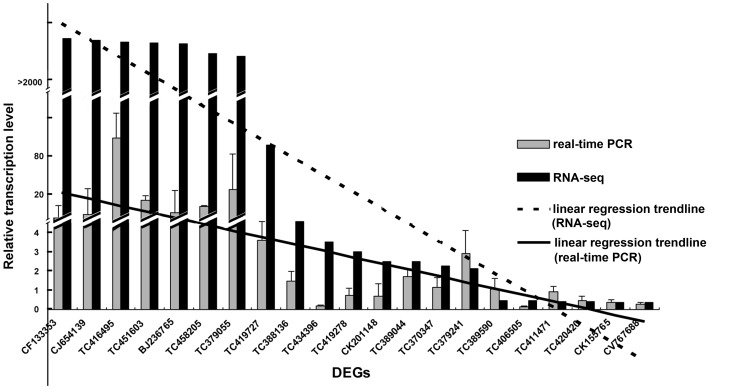
Figure 5. Expression level and trend line of certain DEGs according to RNA-seq and qRT-PCR.
Assessment of the expression level of 21 DEGs, and contrasting of the results with RNA-seq. Ranging the DEGs in size of |log2|ratio plotted horizontal axis (from largest to smallest). The black bars mean the |log2|ratio, and the gray bars mean the 2−ΔΔCT of the DEGs. And the gene annotations are as bellow. CF133353, expressed protein; CJ654139, Os07g0137900 protein; TC416495, MPI; TC451603, LOC496215 protein; BJ236765, unknown; TC458205, high molecular weight glutenin subunit; TC379055, unknown; TC419727, glutathione transferase; TC388136, lipoxygenase 1; TC434396, cinnamyl alcohol dehydrogenase; TC419278, alanine aminotransferase 2, CK201148, chitinase 2; TC389044, peroxidase 8; TC370347, sucrose synthase type I; TC379241, pyruvate decarboxylase isozyme 2; TC389590, thylakoid-bound ascorbate peroxidase; TC406505, phosphoglucomutase; TC411471, ATP synthase subunit a; TC420420, proteasome subunit alpha type-5; CK155765, adenine phosphoribosyltransferase 1; CV767688, triosephosphate isomerase.

