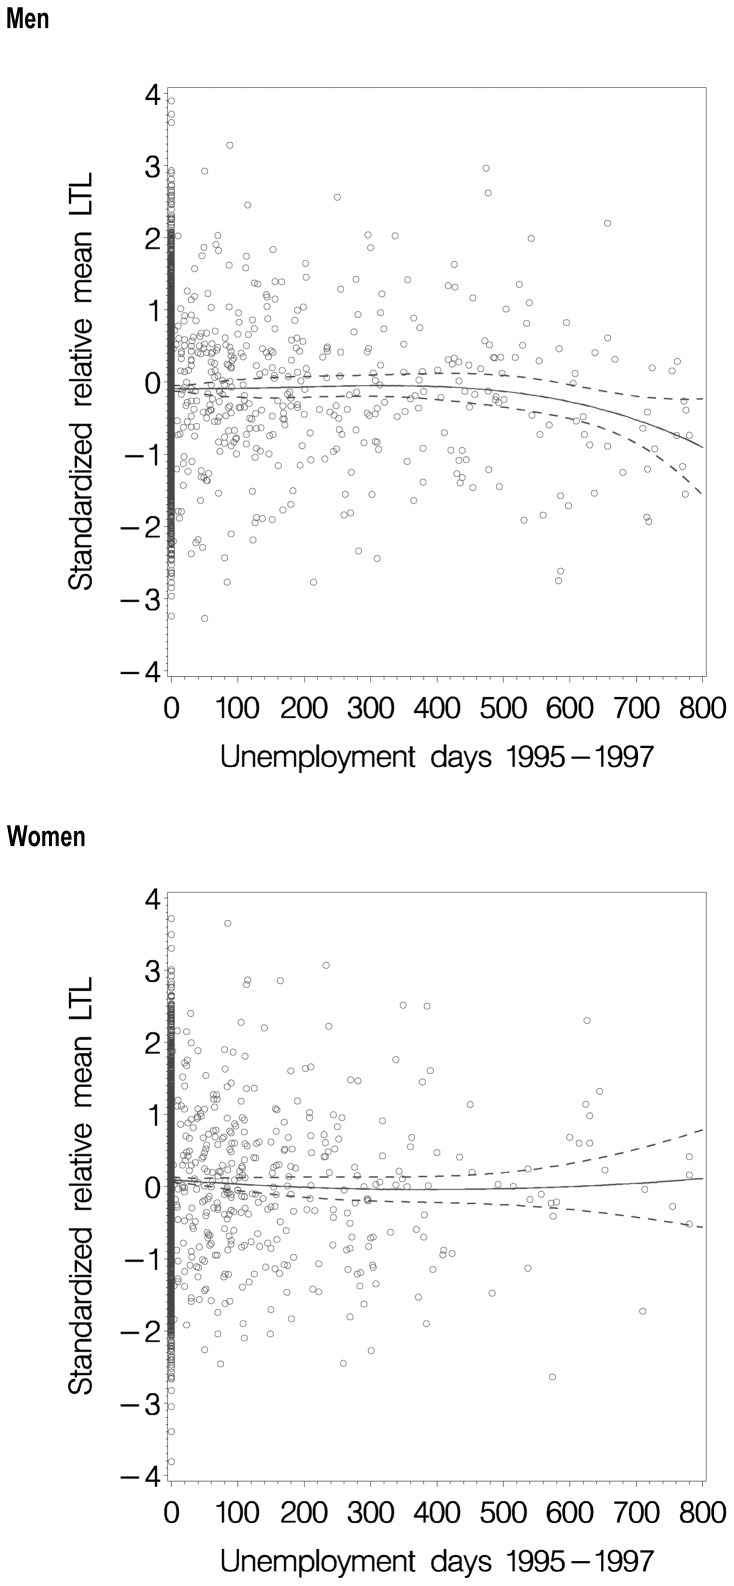
Figure 1. Scatterplots of LTL (standardized relative mean leukocyte telomere length) at follow-up in relation to the number of unemployment days in the preceding three years 1995–97.
The lines indicate the LTL curves fitted to cubic function of unemployment days and the dashed lines their 95% confidence intervals.

