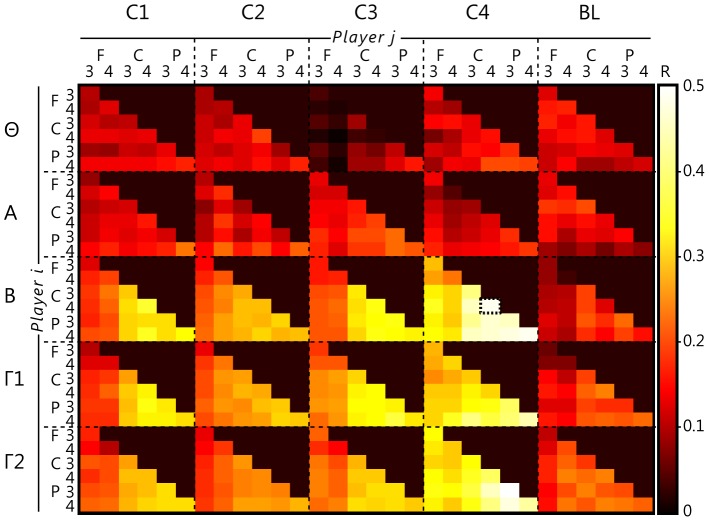
Figure 5. Tonic EEG linkage.
Correlation of power between epochs in five frequency bands (theta, Θ: 4–8 Hz, alpha, A: 8–12 Hz, beta, B: 13–28 Hz, gamma, Γ1: 30–45 Hz and higher gamma, Γ2: 55–80 Hz) between the EEG of two participants over six electrodes (F3/4, C3/4, P3/4) as a function of competition (C1: cooperative, C2: competitive against computer, C3: competitive with computer, C4: against one another, BL: baseline). As an example, the dotted line surrounding a single cell (also indicating the highest difference compared to baseline), occurs in condition C4, beta frequency band, between the right central electrode (C4) of playeri and of playerj.

