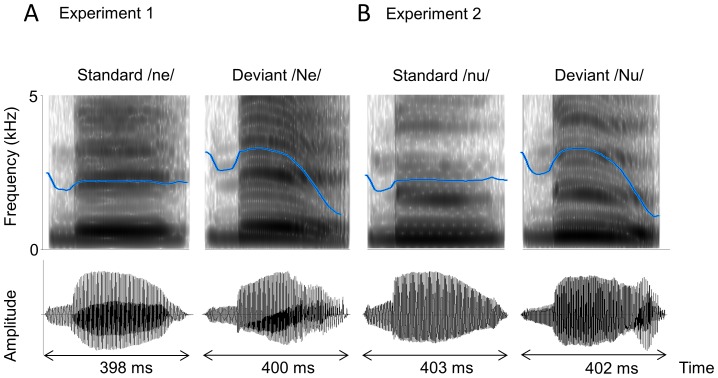
Figure 1. Spectrogram (top) and oscillogram (bottom) of the standard/ne/(A, left) and/nu/(B, left) and the deviant/Ne/(A, right) and/Nu/(B, right) syllables.
The blue line in the spectrogram indicates the average pitch contour. Note the near-flat contour in the standard/ne/and/nu/and the high falling pitch contour in the deviant/Ne/and/Nu/. The F0 contours in/ne/and/nu/or/Ne/and/Nu/are almost the same.

