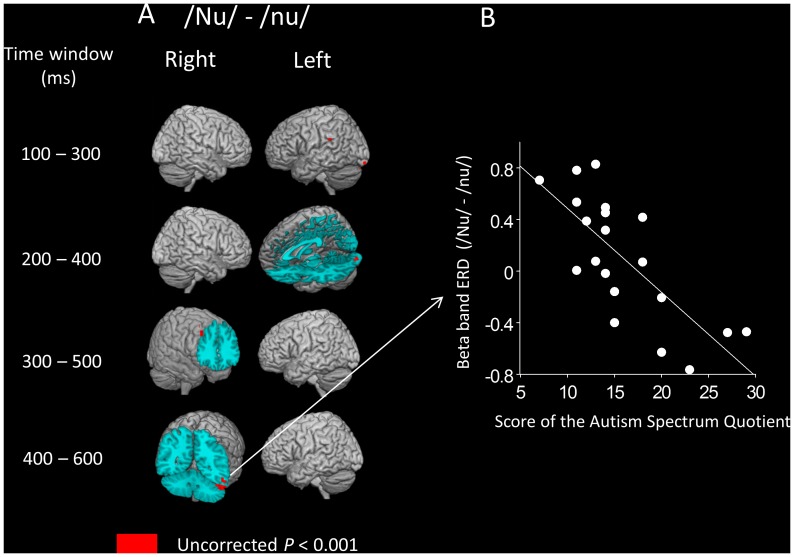
Figure 5. Statistical parametric mapping analyses revealed significant correlation between beta band ERD and AQ score for the “nu” syllable.
A, The AQ score is negatively correlated with differences in beta band ERD (high falling F0 contour “nu” – flat F0 contour “nu”) in the four time windows 100–300 ms (in the left temporal and occipital areas), 200–400 ms (in the left occipital areas), 300–500 ms (in the right frontal areas), and 400–600 ms (in the right temporal areas). B, Scatter plot of the AQ scores and differences in beta band ERD (high falling F0 contour/Nu/− flat F0 contour/nu/) during a time window of 400–600 ms in the right fusiform gyrus (one voxel) in all participants. Higher values in beta band ERD (/Nu/−/nu/) suggest a prominent decrease in the beta band oscillation after the auditory stimuli/Nu/compared with/nu/.

