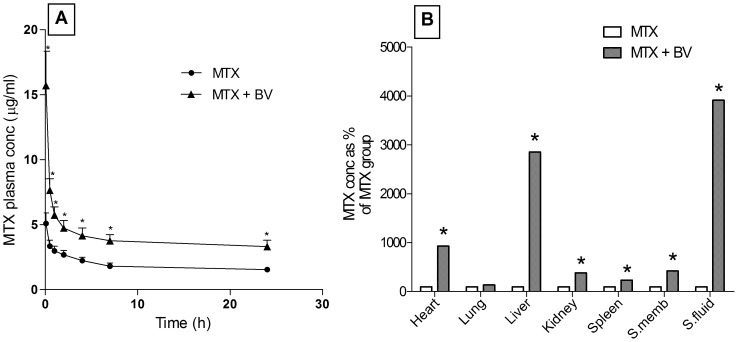
Figure 8. Bee venom effect on plasma concentrations, synovial fluid and tissue concentrations of methotrexate single dose.
Panel A: plasma concentrations of methotrexate, panel B: different tissue concentrations of methotrexate. Data are represented as mean ± SD or percentage change of MTX group (n = 15).* means significantly different from the corresponding MTX group at P<0.05 using unpaired student's t-test.

