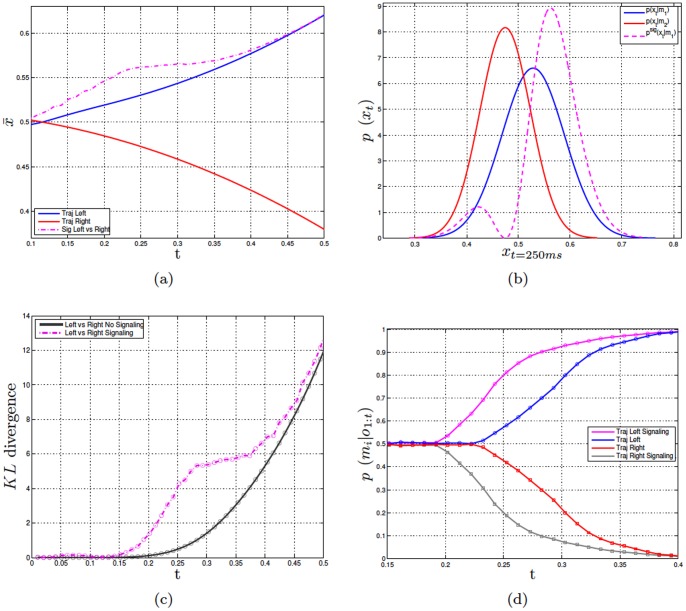
Figure 2. Further analyses of Experiment 1.
Panel a shows the means of the original distributions for  and
and  in blue and red, respectively. In magenta the means of the signaling distribution of
  (i.e., for a leftward movement) is shown. Panel b shows an example of signaling distribution at a given time step rather than the whole trajectory. Sample distributions
  and
and  are taken at time
  of the dynamic Gaussian Process of the two primitives. The parameters of the Gaussian distributions at time
  are
are  ,
,  ,
,  and
and  . The resulting distribution
  is computed from Eq.
  . The weights coefficients are set as
  . This means that the two distributions are equally weighted in the computing of the signaling distribution. Panel c shows the KL divergence between two actions:
  vs.
vs.  . Panel d shows the perceiver’s probability of recognizing the right action (i.e., the probability
  of perceiving
  given the observations
  until time
  ) when the performer uses the original
  distribution (blue = left, red = right) and the signaling distribution (magenta = left, black = right).

