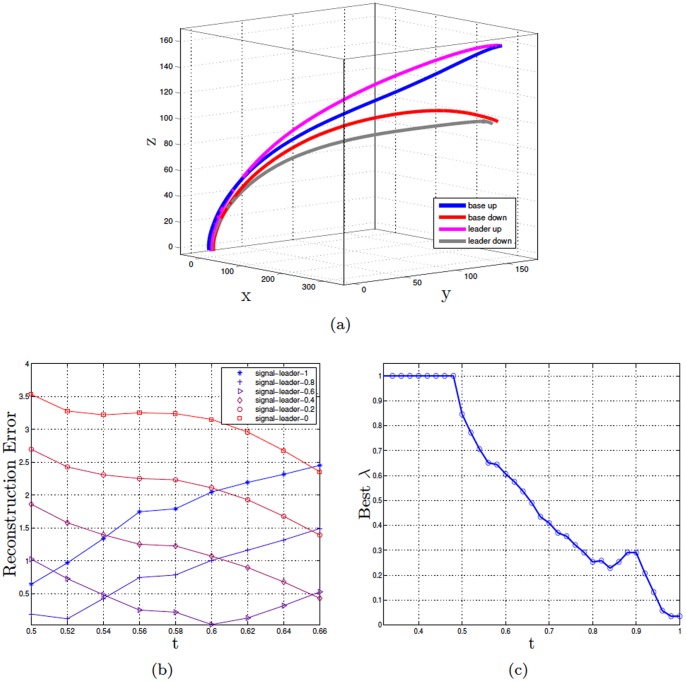
Figure 3. Experiment 2.
Panel a shows the average trajectories (Leader vs. baseline condition) to reach the top and bottom of the bottle in the human study reported in [17]. Panel b shows the reconstruction error (sum of squares error between the human data and the modeled trajectories) for the trajectories of the Leader, using the signaling distribution and various values of  . The Figure shows a time window in the data, not the whole trajectory. The specific window is between 0.5 and 0.66 (trajectory length is normalized to 1). Panel c shows a
  -profile: the values of optimized
  for each time step
  on the sequences of the Leaders’ reaching up movements. It measures the amount of signaling during the reaching up action.

