Figure 7.

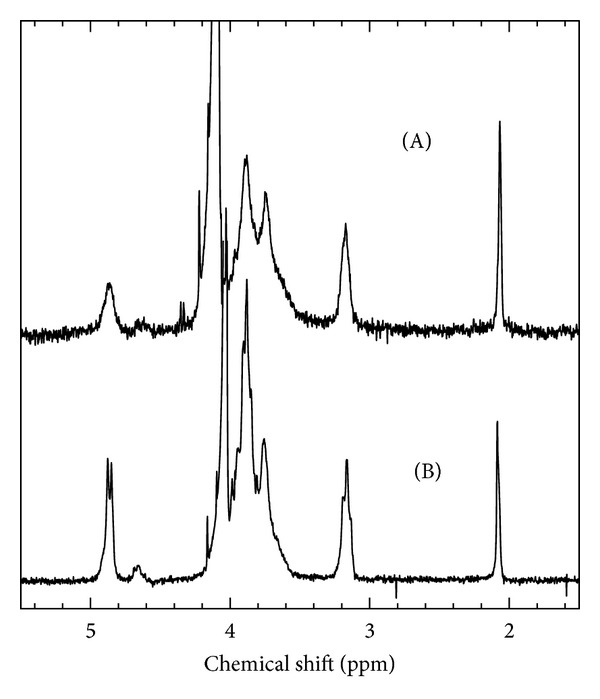
1H NMR spectra of (A) original chitosan and (B) the fragment in 2% (w/w) CD3COOD/D2O at 70°C. The fragment obtained from hydrolysis (sample F19, Table 2).

1H NMR spectra of (A) original chitosan and (B) the fragment in 2% (w/w) CD3COOD/D2O at 70°C. The fragment obtained from hydrolysis (sample F19, Table 2).