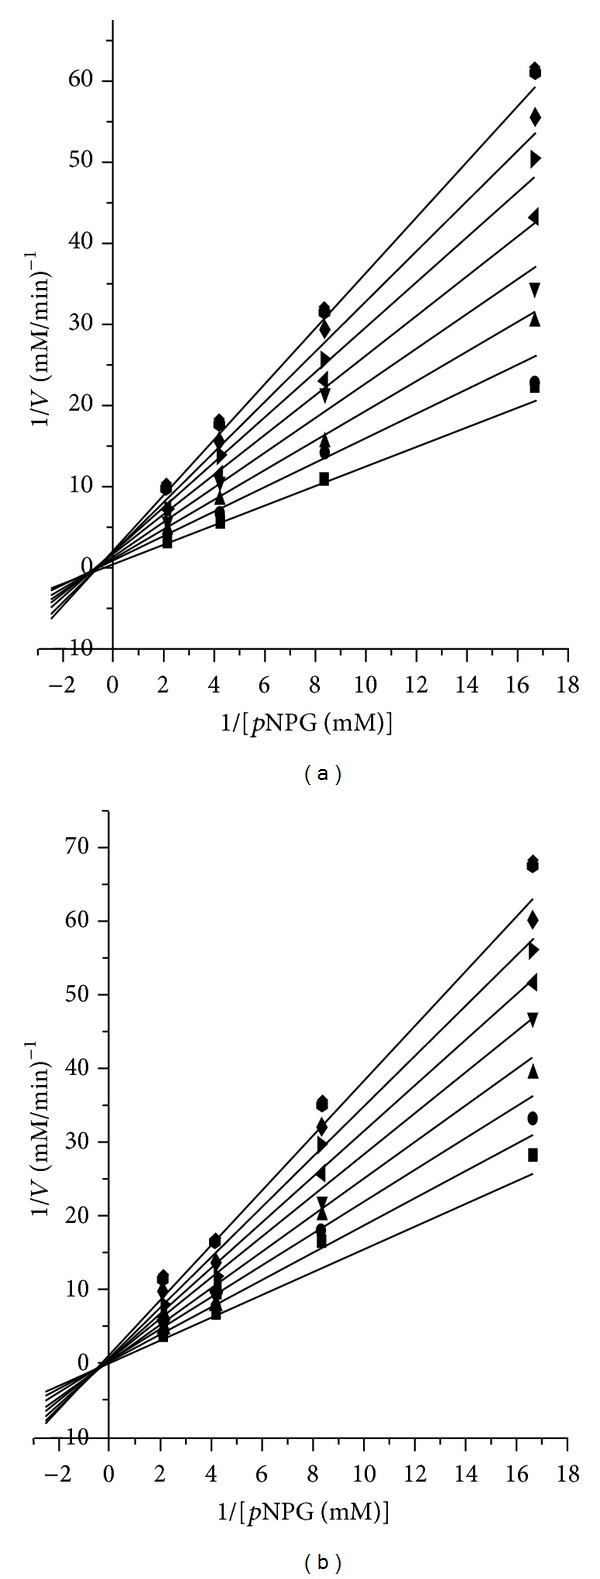
Figure 2.

Lineweaver-Burk plots of α-glucosidase inhibition at different concentrations of (a) acarbose and (b) extract aqueous from A. macroprophyllata. 0.0 mg/mL (■), 0.2 mg/mL (⚫), 0.4 mg/mL (▲), 0.6 mg/mL (▼), 0.8 mg/mL (◂), 1.0 mg/mL (▸), 1.2 mg/mL (◆), 1.4 mg/mL (⬢).
