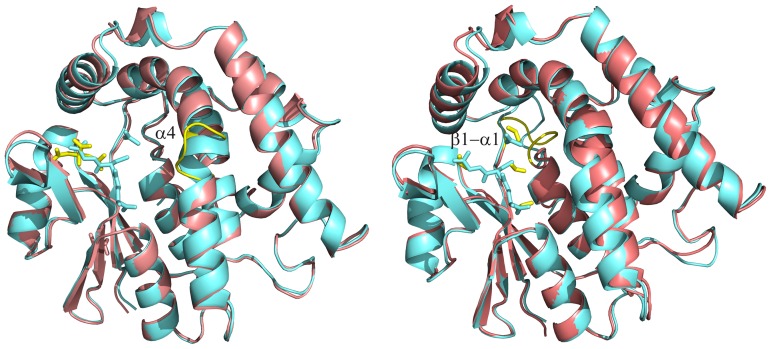
Figure 3. Views of the superpositions of PcGSTFuA1-2 monomers (left) and PcGSTFuA1-3 monomers (right).
PcGSTFuA1 cartoon is colored aquamarine while PcGSTFuA2-3 cartoons are colored salmon. The ‘fold diversities’ in PcGSTFuA1-3 isoforms are highlighted in yellow : (left) the disruption of the helix α4 in PcGSTFuA2 ; (right) the loop β1-α1. Ligands are shown in stick mode. Glutathione and acetate molecules bound in PcGSTFuA1 are colored aquamarine. Citrate molecule (left) and formate molecules (right) molecules bound in PcGSTFuA2 and 3, respectively, are colored yellow.

