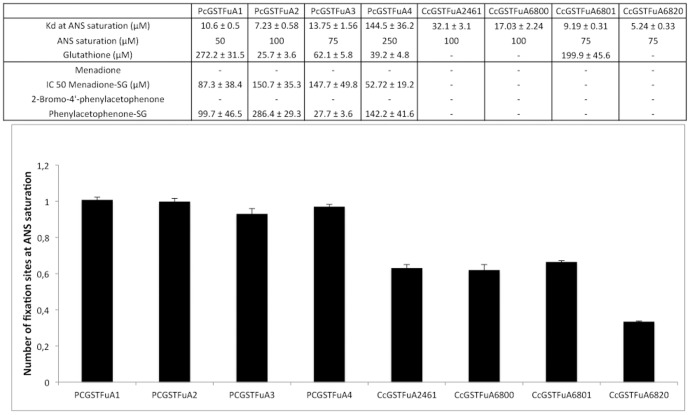
Figure 5. ANS binding and competition experiments onto PcGSTFuAs and CcGSTFuAs.
(A) Kd values were determined by plotting concentration of ANS bound onto GSTFuAs against concentration of free ANS. Values given for glutathione, menadione-SG and phenylacetophenone-SG the values given are IC50 obtained by fitting data to equation 2 described in Material and Methods. (B) Number of binding sites for PcGSTFuAs and CcGSTFuA determined by fitting data to Equation 1.

