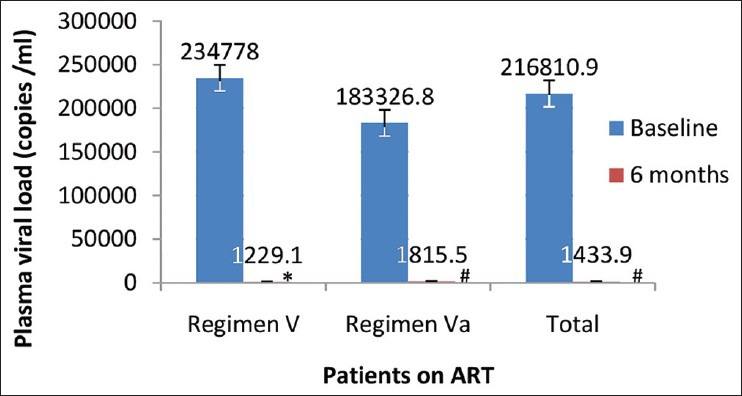
Figure 2.

Comparison of mean plasma viral load of human immunodeficiency virus positive patients treated with second line antiretroviral therapy at different time interval (n = 126) *P< 0.001 as compared to baseline, # P< 0.0001 as compared to baseline
