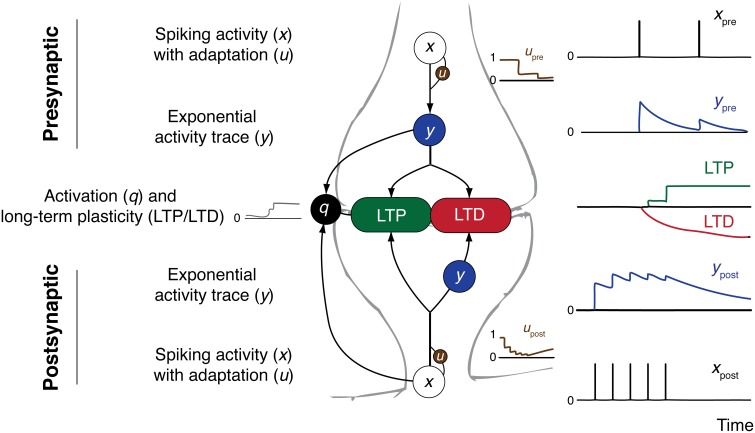
Figure 1.
Overview over the CD model and its constituents. Presynaptic (top) and postsynaptic (bottom) contributions to synaptic plasticity are shown. Arrows indicate direction of influence according to model equations. On the right side example spike trains and resulting traces of the variables are shown.

