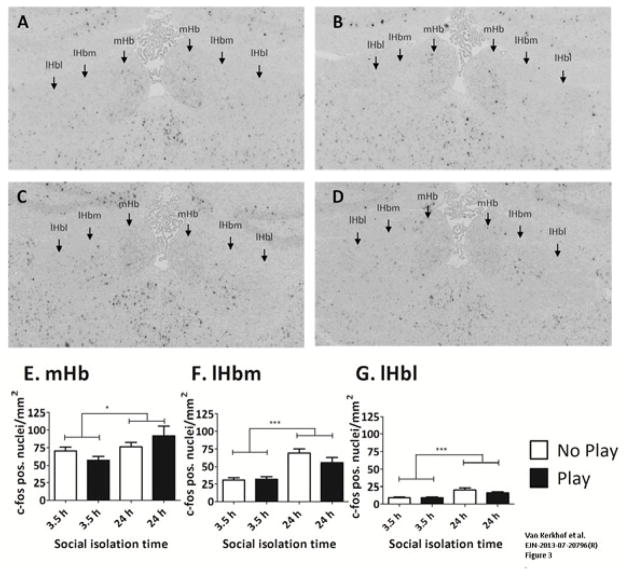
Fig. 3.
Social isolation for 24 h enhances the cell density of c-fos-positive cells. The FpCD was determined in rats after 3.5 or 24 h of social isolation and subsequently receiving a play session (play; black bars) and in rats that were placed in the test cage without a partner (no play; white bars). Representative pictures of c-fos labelling after 3.5 h no play (A), 3.5 h play (B), 24 h no play (C), and 24 h play (D). The contrast of these images was enhanced for illustrative purposes (CorelDraw Graphics X5, contrast +40%, brightness -25%). Note that original images were used for the analysis. Quantification of c-fos-positive cells in the four groups in the mHb (E), lHbm (F) and lHbl (G). Data are presented as mean + SEM. *p < 0.05, ***p <0.001.

