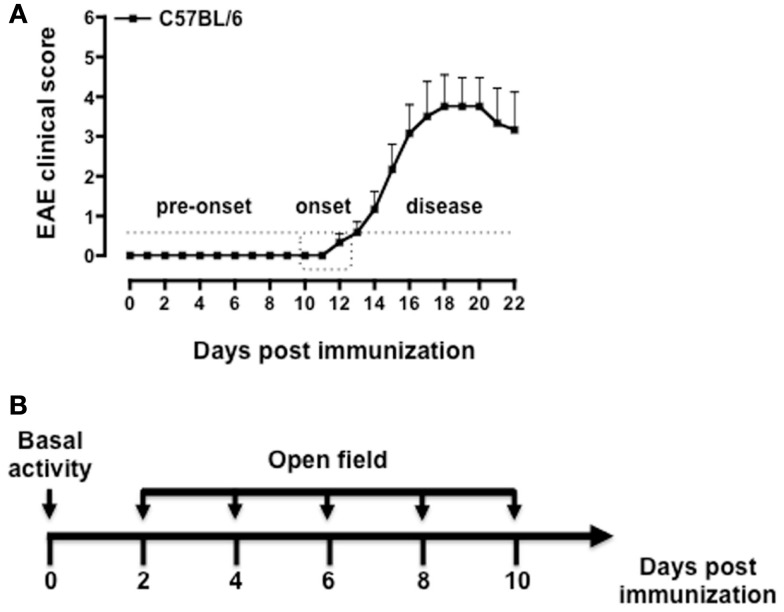
Figure 1.
Phases of the disease in MOG35–55-induced EAE and behavioral assessment protocol. The graph in (A) shows a typical pattern of development of the EAE clinical score with the three main phases of the disease while the scheme in (B) shows a schematic of the behavioral test protocol used in the study. The results in (A) are from a single experiment with n = 10 mice and are representative of N = 5–6 separate experiments.

