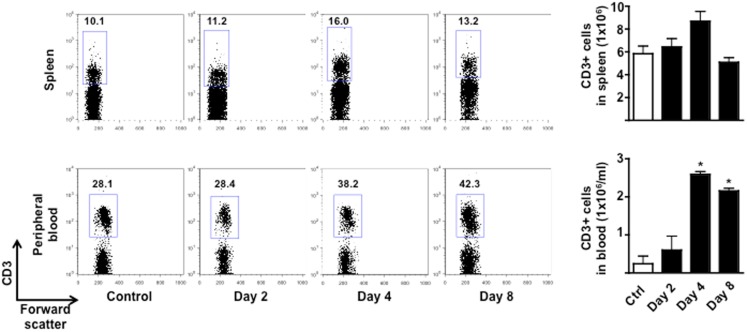
Figure 3.
Expansion and mobilization of T cells during the early stages of MOG35–55-induced EAE. The dot plots show the percentages of CD3+ T cells while the bar graphs show the comparison of the total number of CD3+ T cells in spleen (top panels) or peripheral blood (bottom panels) of control or MOG35–55-immunized mice. Values are expressed as mean ± SEM for three to four mice. *p < 0.05 indicates significant values compared to control mice.

