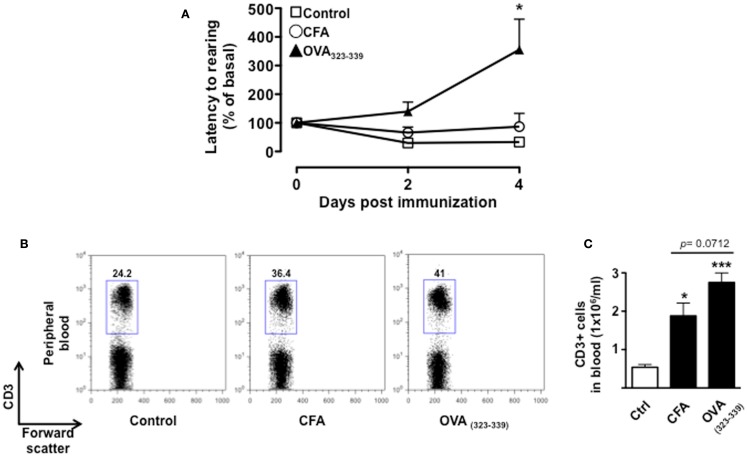
Figure 5.
The increase in latency to rearing relies on T cell antigenic stimulation. The graph in (A) shows the percentage of latency to rearing of control, CFA only or OVA323–339-immunized mice. Values are expressed as mean percentage ± SEM of the basal activity for eight to nine mice. The dot plots (B) show the percentages of CD3+ T cells while the bar graph (C) shows the comparison of the total number of CD3+ T cells in peripheral blood of control, CFA only or OVA323–339-immunized mice at day 4. The results are representative of n = 6–8 mice.

