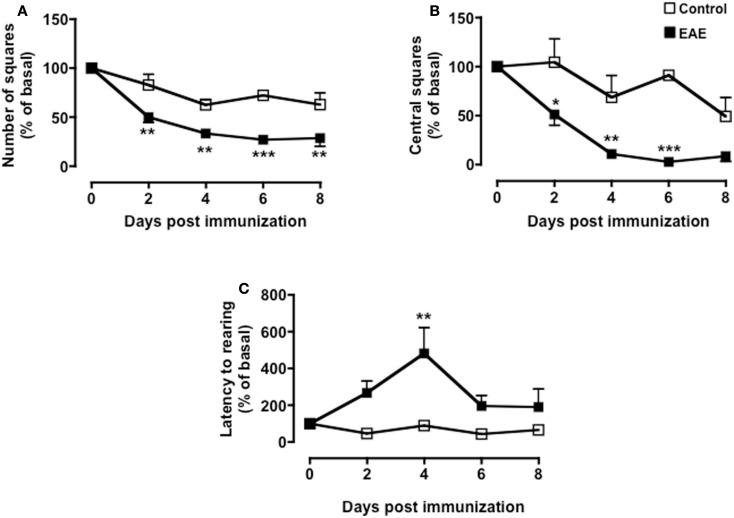
Figure A1.
Behavior of MOG35–55-immunized mice in the open field test. The graphs show the percentage of total number of squares crossed (A), number of central squares entries (B), and latency to rearing (C) of control or MOG35–55-immunized mice compared to their baseline levels assessed during a 5-min test. Values are expressed as mean percentage ± SEM for six to eight mice and are representative of N = 5–6 separate experiments. *p < 0.05, **p < 0.01, ***p < 0.001 indicate significant values compared to control mice.

