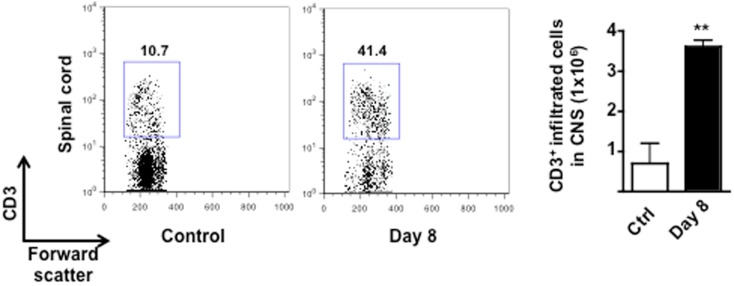
Figure A3.
Infiltration of T cells in the CNS of MOG35–55-immunized mice. The dot plots and bar graph show the comparison of the percentages and total number of CD3+ T cells infiltrated in the spinal cord of control or MOG33–55-immunized mice. Values are expressed as mean ± SEM for three mice and are representative of N = 3 separate experiments. **p < 0.01 indicates significant values compared to control mice.

