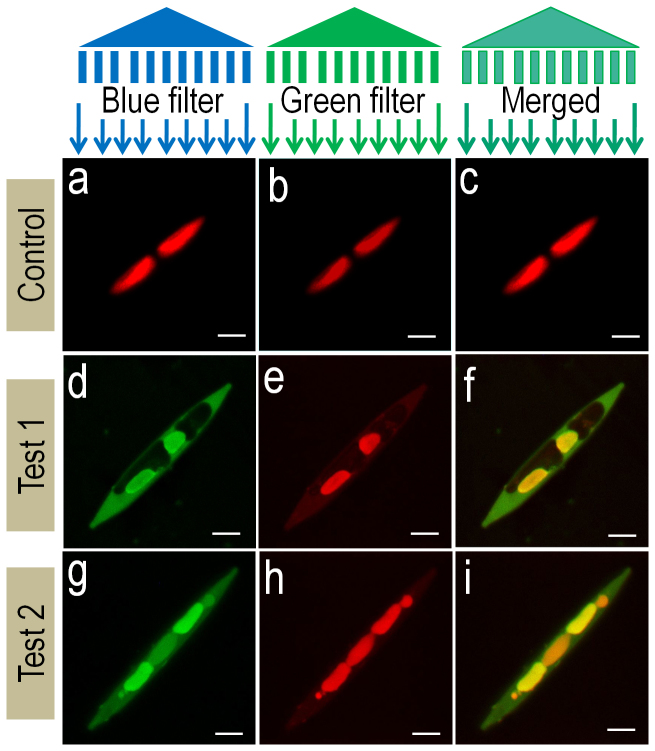
Figure 7. Fluorescent diatom.
Fluorescence confocal microscopic images of Nitzschia. (a–c) Control represents N. palea without fluorophore addition and (d–i) test 1 and test 2 represents Nitzschia with fluorophore addition. Light filter and its wavelengths used for imaging - (a), (d), (g) blue filter, 543 nm. (b,e,h) green filter, 488 nm. (c), (f), (i) are the merged images from respective groups. Scale bar = 5 μm.

