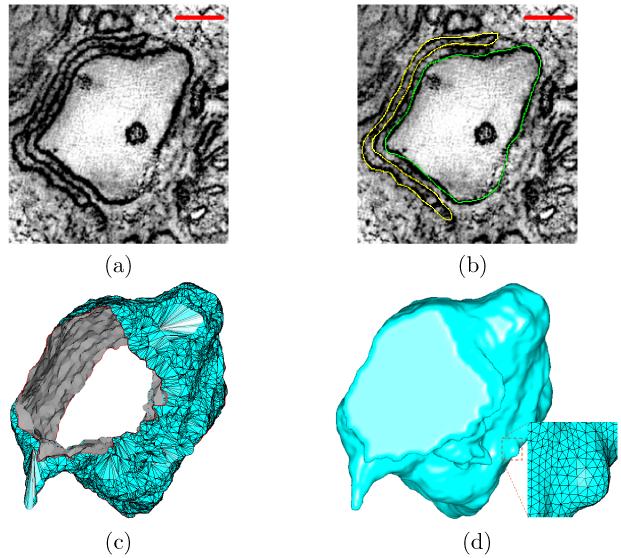
Figure 2.
From electron microscopic images to surface meshes. (a) A cropped sample slice of EM tomography (scale bar: 100nm). (b) The manually segmented t-tubules (green) and jSR (yellow) structures. (c) The surface mesh reconstructed from the segmented contours. The numbers of vertices and triangles are 5, 993 and 11, 650 respectively. The minimal and maximal angles are 0.18° and 175.4° respectively. (d) The regenerated surface mesh, with 35, 348 vertices and 70, 694 triangles. The minimal and maximal angles are 15.7° and 140° respectively. Note that the holes on both ends of the structure have been closed for subsequent tetrahedral mesh generation and numerical simulation.

