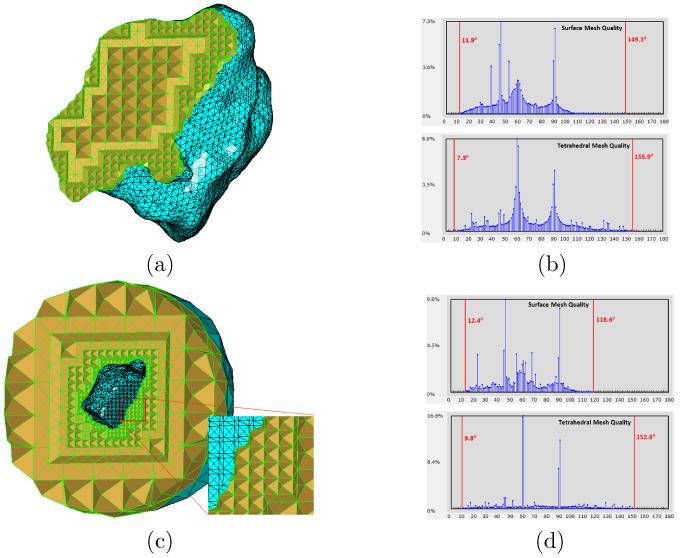
Figure 8.
Tetrahedral mesh generation for the t-tubular structure shown in Fig. 2(d). (a) Tetrahedral mesh, consisting of 13, 013 vertices and 52, 040 tetrahedra, inside the given surface domain. (b) The histograms of both domain surface mesh and entire tetrahedral mesh. The minimal and maximal angles (for surface mesh, top) or dihedral angles (for tetrahedral mesh, bottom) are indicated by red vertical bars. (c) Tetrahedral mesh, consisting of 9, 294 vertices and 42, 649 tetrahedra, outside the given surface domain. (d) The histograms of both domain surface mesh and entire tetrahedral mesh.

