Figure 2.

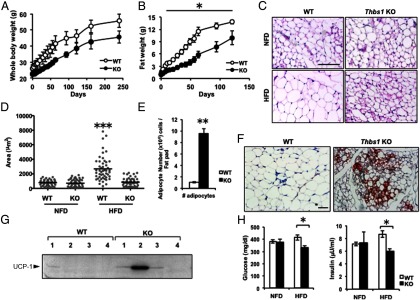
Thbs1-null mice are protected from HFD-induced obesity. A, Body weight change during a 45% HFD feeding. WT and Thbs1-null (KO) male mice, fed a 45% HFD beginning at age 8 weeks (n = 8 for each group). B, Fat mass assessed with a nuclear magnetic resonance body composition analyzer (n = 8). C, H&E staining of inguinal white adipose tissues. Upper panel, Eleven-week-old male mice fed normal fat diet (NFD). Lower panel, Eleven-week-old male mice fed a 45% fat diet (HFD) for 3 weeks. Scale, 100 μm. D, The morphometric quantification of adipocyte size in adipose tissue (square micrometers, n = 50 adipocytes per field). E, The number of adipocytes per tissue. Open bar, WT; closed bar, Thbs1 KO mice. F, UCP1-positive adipocytes within iWAT (brown); nuclei are counterstained (blue). G, Western blot of UCP1 in tissue lysates of inguinal adipose tissues (n = 4 for each group). H, The levels of serum glucose (left panel) and insulin (right panel) in mice fed a NFD or HFD for 3 weeks (n = 8, mean ± SEM). *, P < .05 compared with WT.
