
Figure 7.
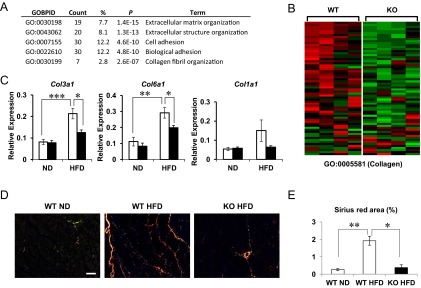
Thbs1-dependent skeletal muscle gene expression. A, The list of Gene Ontology Biological Pathway (GO-BP) pathways significantly different between the two groups. B, A representative heat map shows the expression profile of the genes listed in GO: Collagen (GO: 0005581). C, The expression of collagen family members (Col3, Col6, Col1) in the quadriceps muscles isolated from WT and KO mice after 3 weeks of a NFD or a 45% HFD (n= 8 each, mean ± SEM). D, Picosirius Red staining of quadriceps femoris observed under polarized microscopy. WT mice fed a normal diet (WT NFD), fed a 45% HFD (WT HFD), and Thbs1-KO mice fed HFD (KO HFD). Thinner (green) and thick collagen fibers (yellow-orange) are shown. E, The quantification of the percentage area positive for Picosirius Red staining. Two sections from each mice were analyzed, four mice for each group (mean ± SEM). *, P < .05; **, P < .005; ***, P < .0005.