Figure 1.
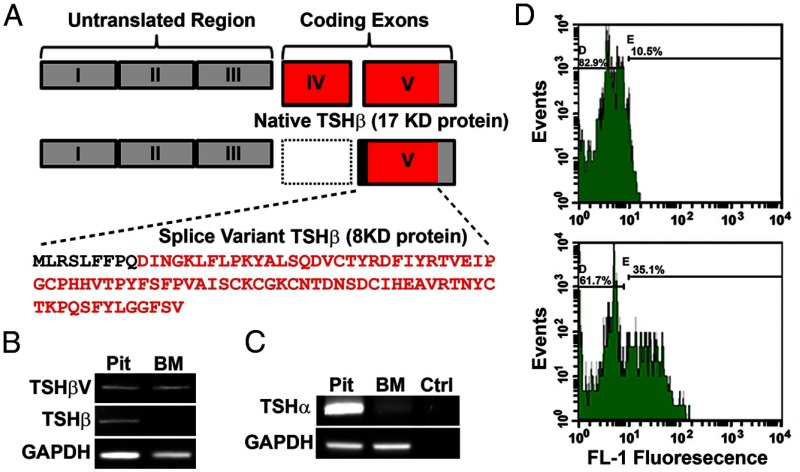
BM cells produce TSH-βv. (A) A schematic comparison of native TSH-β and novel TSH-βv. Of note is a missing exon IV in the splice variant resulting in a smaller peptide of 8 vs 17 kDa for the full-length peptide. The sequence of TSH-βv is also shown with the intronic region in bold. (B) The result of native TSH-β and novel TSH-βv PCR amplimer generation in C57/BL murine pituitary and BM samples. The PCR product size of 470 bp was exclusively found in the pituitary sample and corresponds to that of native TSH-β and contrasts with the PCR product size for the TSH-βv of 300 bp, which was found in both the pituitary and BM. (C) PCR amplification of the TSH-α gene was only positive in the pituitary sample. (D) BM cells were flushed from the femur and the red blood cells lysed and stained for TSH followed by FACS analysis. These figures depict TSH protein expression in fixed BM cells detected with anti-TSH-β (bottom) or control IgG (top) with a green fluorescent protein-labeled second antibody. GAPDH, glyceraldehydes-3-phosphate dehydrogenase. Ctrl, control; FL-1, fluorescence intensity; Pit, pituitary.

