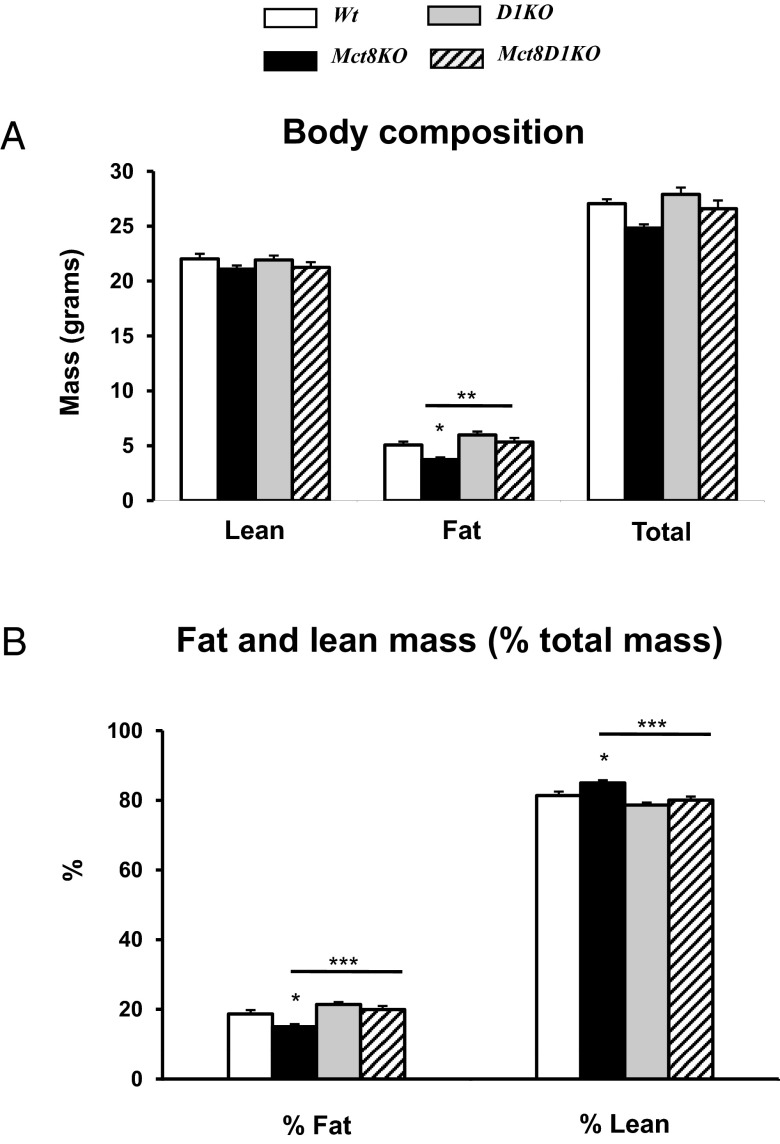
Figure 1.
DEXA study of Wt, Mct8KO, D1KO, and Mct8D1KO mice. A, Body composition. B, Fat and lean mass expressed as percentage of total body mass. Genotypes are indicated. Asterisks represent P values by ANOVA and Newman-Keuls test. Significant differences compared with Wt animals are above the SEM bars. Comparisons of Mct8KO and Mct8D1KO are indicated by horizontal lines. *, P < .05; **, P < .01; ***, P < .001.

