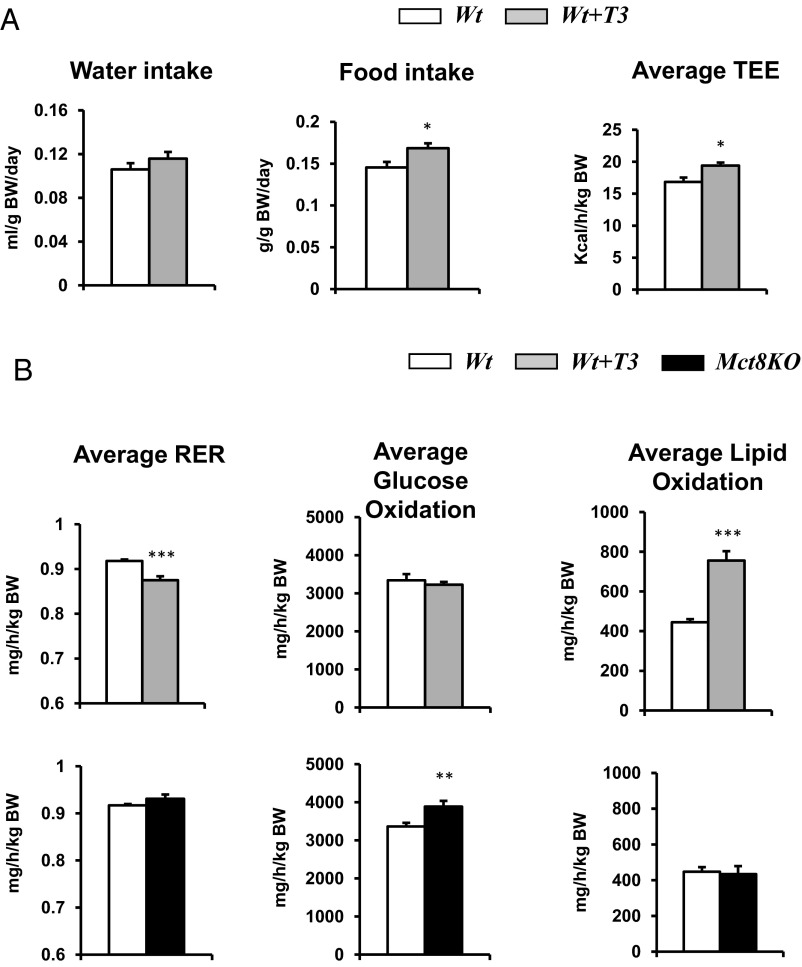
Figure 6.
Metabolic cage study of Wt T3-treated mice. A, Average 24-hour food intake, water intake, and TEE in Wt T3-treated mice compared with Wt. B, Average 24-hour RER and glucose and lipid oxidation in Wt T3-treated and Mct8KO mice compared with Wt. Genotypes are indicated. Statistical analyses were performed by a 2-tailed Student's t test for unpaired observations. *, P < .05; **, P < .01; ***, P < .001.

