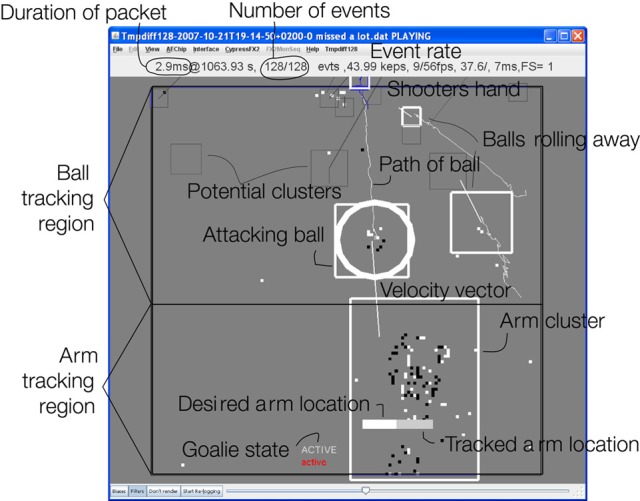
Figure 3.

Snapshot of action showing 128 events (all events within 2.9 ms) from the vision sensor. It shows 5 tracked objects (the middle 3 are real balls, the top one is the shooter's hand, and the bottom object is the goalie arm). The Attacking ball rolling toward the goal (and being blocked) is marked with a circle; other balls are tracked but ignored. The thin squares represent potential clusters that have not received sufficient support. The velocity vectors of each ball are also shown as a slightly thicker line and have been computed by least squares linear regression over the past 10 packets of events. The goalie arm is being moved to the left bar and the presently tracked location of the arm is shown as a light bar inside the arm cluster. The state of the goalie is indicated as “active” meaning a tracked ball is being blocked. The balls generate average event rates of 3–30 keps (kilo events per second). The mean event rate for this packet was 44 keps.
