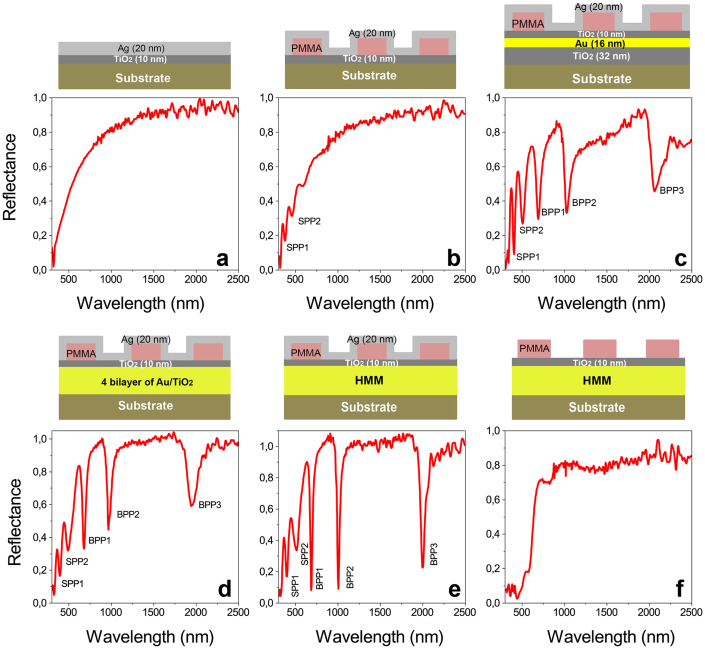
Figure 4. Reflectance spectra as a function of excitation wavelengths.
Studied structure is shown above each graph: (a) Uniform Ag layer of 20 nm thickness on a TiO2/glass substrate, (b) Reference sample (Ag grating on a TiO2/glass substrate), (c) Control sample (Ag grating on a 1 bilayer of Au/TiO2), (d) Ag grating on a 4 bilayers of Au/TiO2, (e) Hypergrating (Ag grating on a 6 bilayers of Au/TiO2), and (f) hypergrating without Ag layer on top of the grating. (a)–(f) Incident grazing angle is taken to be 50°. In figures (b)–(e), SPP and BPP respectively represent the surface plasmon polaritons and bulk plasmon polaritons.

