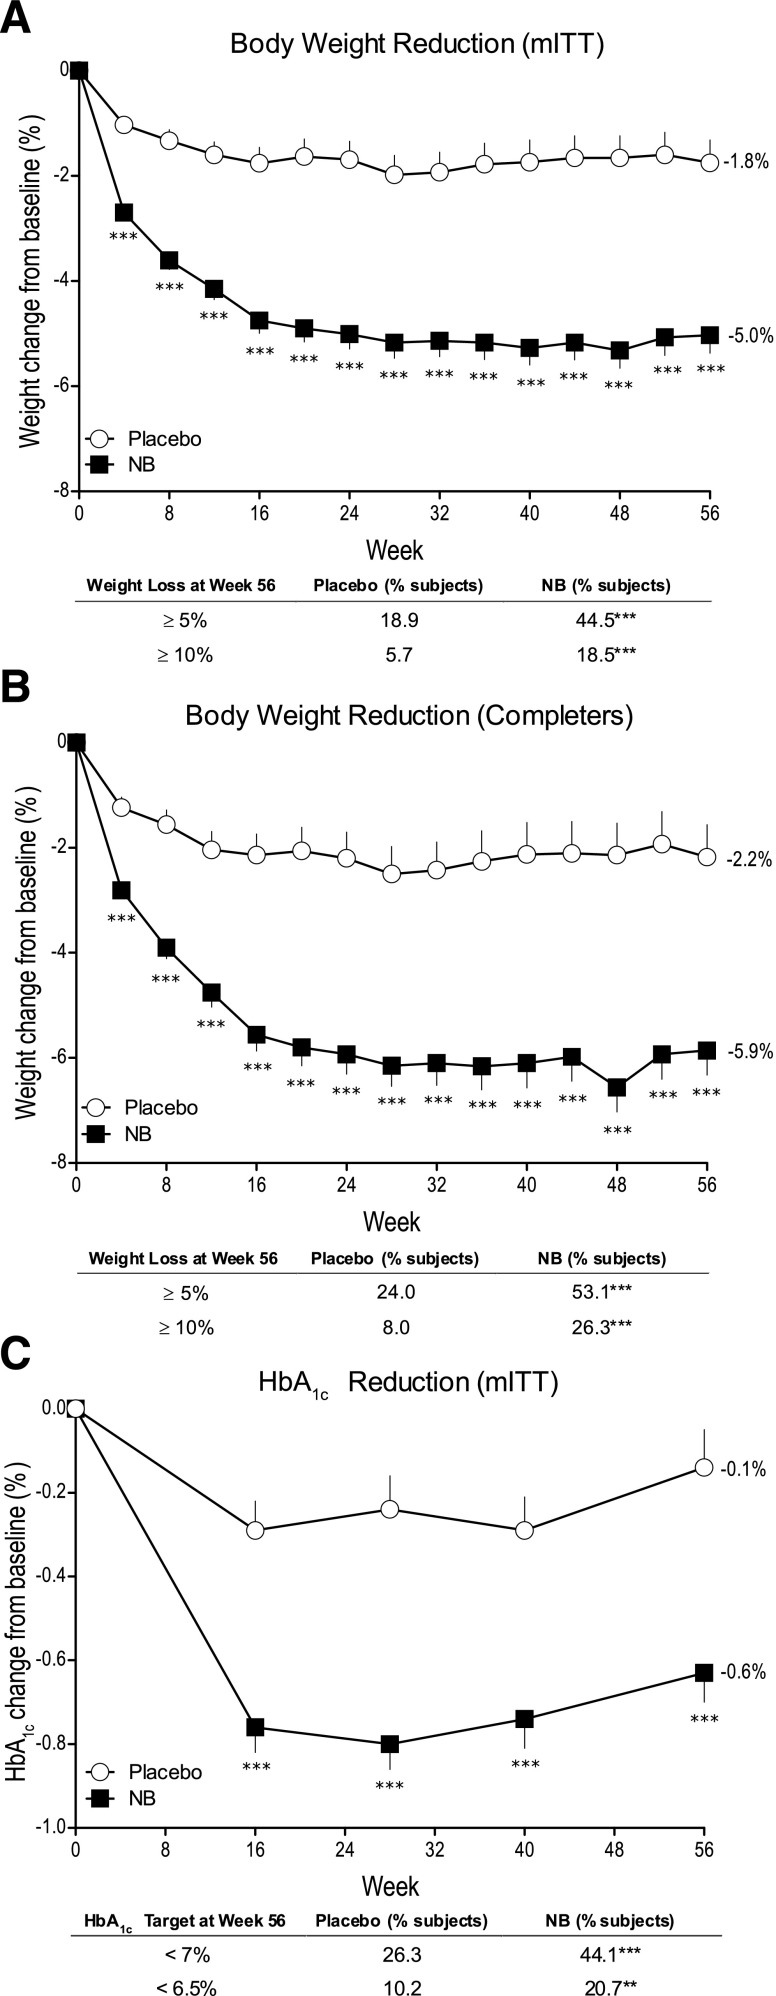
Figure 1.
A: Body weight change from baseline in the mITT LOCF population. Data are LS mean ± SE. Placebo, n = 159; NB, n = 265. ***P < 0.001 vs. placebo; except for change from baseline to week 56 end point for mITT LOCF population, P values are nominal (i.e., not adjusted for multiple comparisons) and associated with exploratory analyses. B: Body weight change from baseline to week 56 end point; placebo, n = 100; NB, n = 175. ***P < 0.001 vs. placebo; except for ≥5% weight loss category for the mITT-LOCF population, P values are nominal (i.e., not adjusted for multiple comparisons) and associated with exploratory analyses. C: Change in HbA1c from baseline to week 56 end point; placebo, n = 137; NB, n = 222. **P < 0.01 vs. placebo; ***P < 0.001 vs. placebo; the mITT LOCF population consists of patients who had a baseline measurement and at least one postbaseline measurement while on study drug. The last observation on study drug was carried forward. The completer population comprised all randomized patients with a baseline measurement and a 56-week measurement while on the study drug.

