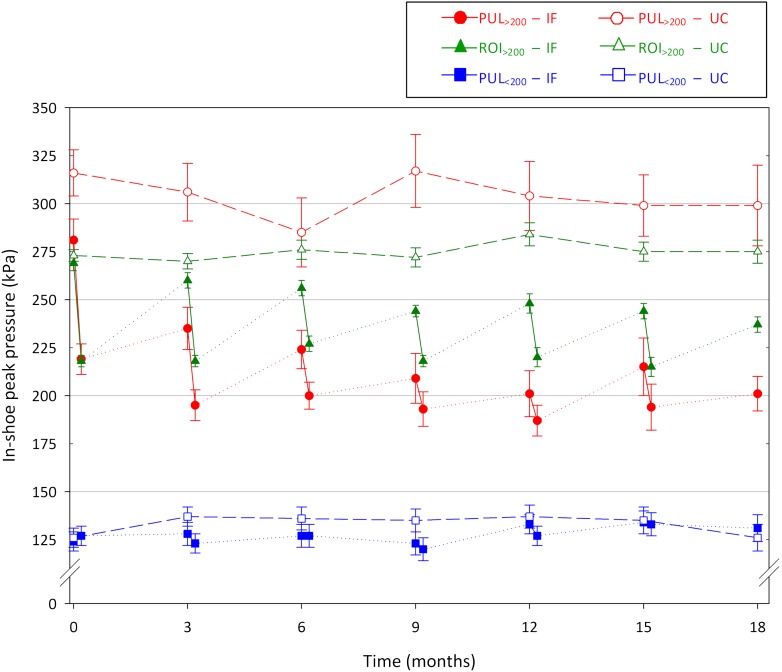
Figure 2.
Mean in-shoe peak pressures over 18 months of follow-up for all previous ulcer locations with peak pressure at footwear delivery >200 kPa (red), all previous ulcer locations with peak pressure <200 kPa (blue), and all regions of interest with peak pressure >200 kPa (green) for both the improved footwear (closed symbols) and the usual care (open symbols) groups. Changes in peak pressure at each follow-up in the improved footwear group are pressure changes after footwear modification. Error bars represent SEMs. IF, improved footwear; PUL, previous ulcer location; ROI, region of interest; UC, usual care.

