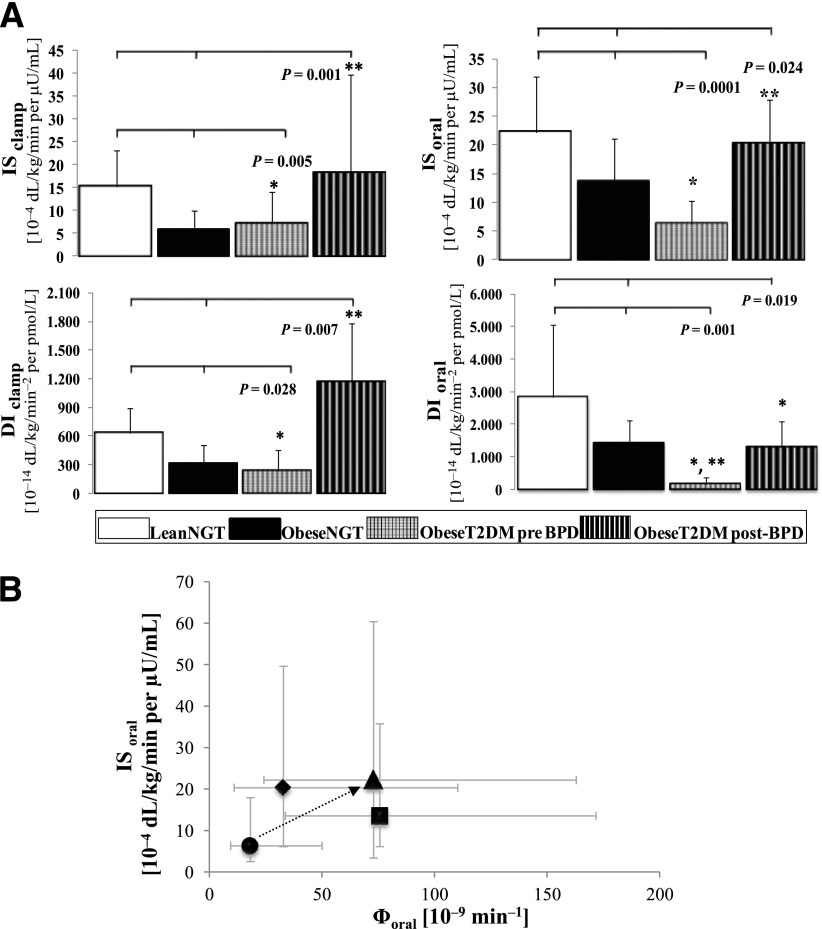
Figure 1.
A: Comparison of the IS and the DIs obtained from the oral and the intravenous mathematical minimal models in the pre-BPD and post-BPD groups and the two control groups. B: Relationship between IS and overall β-cell responsivity during the OGTT in the pre-BPD and post-BPD groups and in the two control groups. A: Bars represent the median and semi-interquartile range. The Kruskal-Wallis test and Duncan post hoc test were used. *P < 0.05 vs. LeanNGT; **P < 0.05 vs. ObeseNGT. B: Data are presented as the median and interquartile range. Black circle, ObeseT2DM pre-BPD group; black triangle, ObeseT2DM post-BPD group; black square, ObeseNGT group; black diamond, LeanNGT group.

