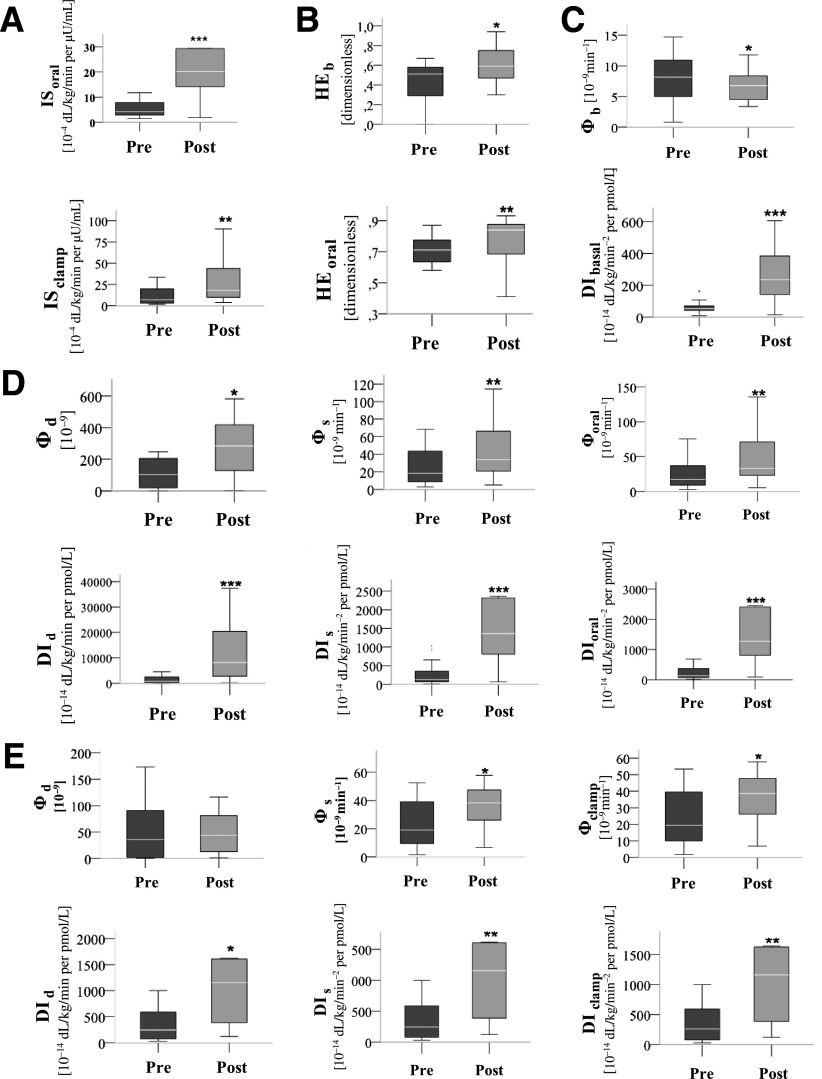
Figure 2.
Effect of BPD on IS (A); basal and orally stimulated HE of insulin (B); basal β-cell function (C); the dynamic, static, and total β-cell functional parameters from the OGTT (D); and the hyperglycemic clamp test (E). *P < 0.05; **P < 0.01; ***P < 0.001. Wilcoxon signed rank test for related samples, considering only the patients who underwent the BPD procedure (n = 20).

