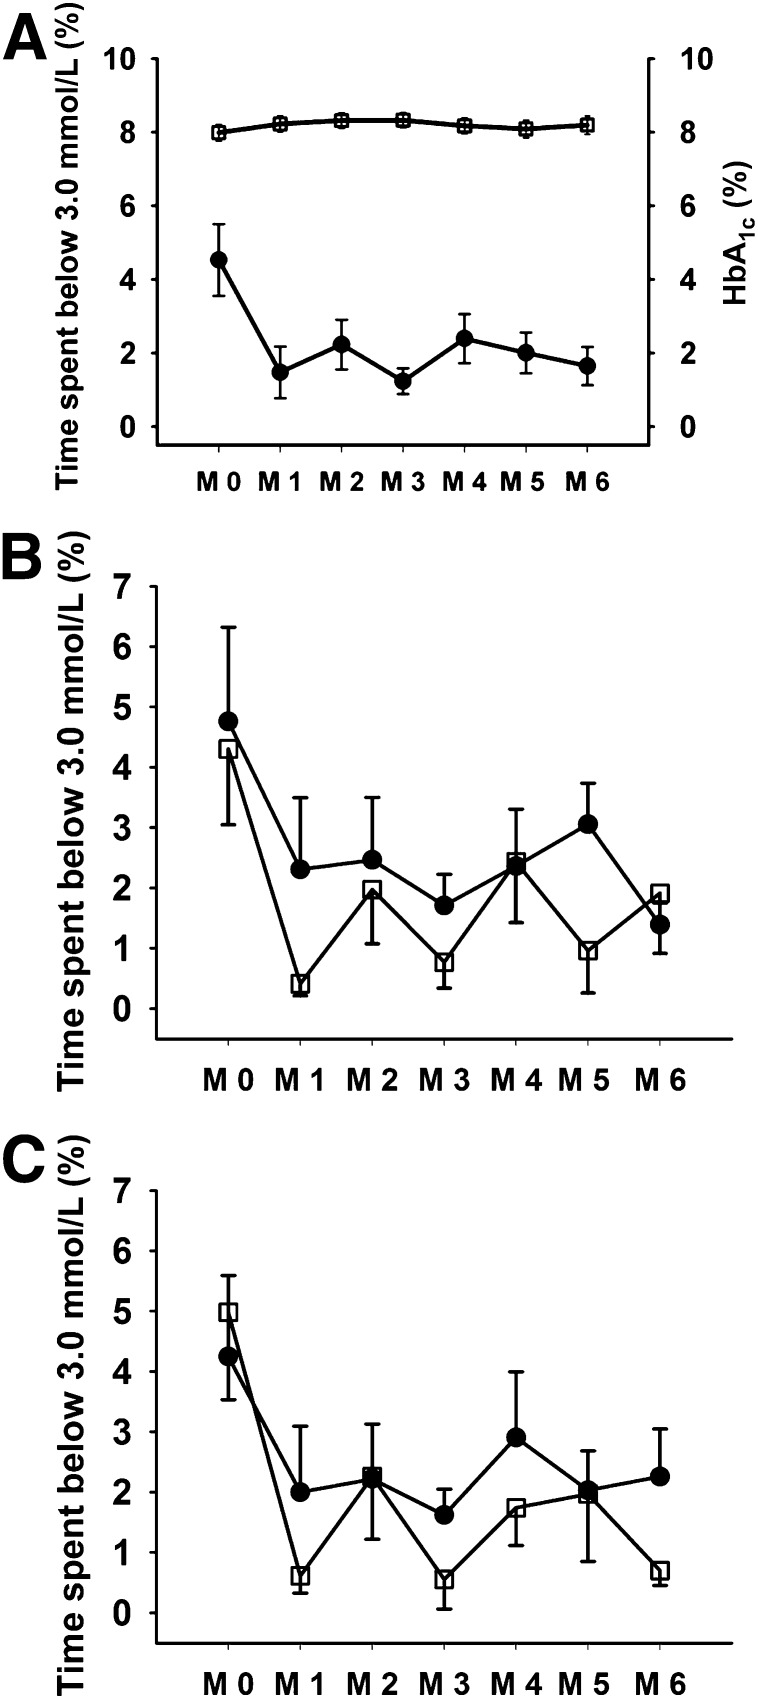
Figure 1.
A: Time spent <3.0 mmol/L (%) (●) during monthly blinded continuous glucose monitoring and HbA1c (%) (□) during the study intervention for the whole clamp cohort (N = 18). Data shown are mean ± SEM. (M 0, baseline, M 1 to M 6, end of each study month.) B: Time spent <3.0 mmol/L (%) during monthly blinded continuous glucose monitoring for MDI (N = 9) (●) and CSII (N = 9) (□) groups. C: Time spent <3.0 mmol/L (%) during monthly blinded continuous glucose monitoring for non–RT-CGM (N = 11) (●) and RT-CGM (N = 7) (□) groups.

