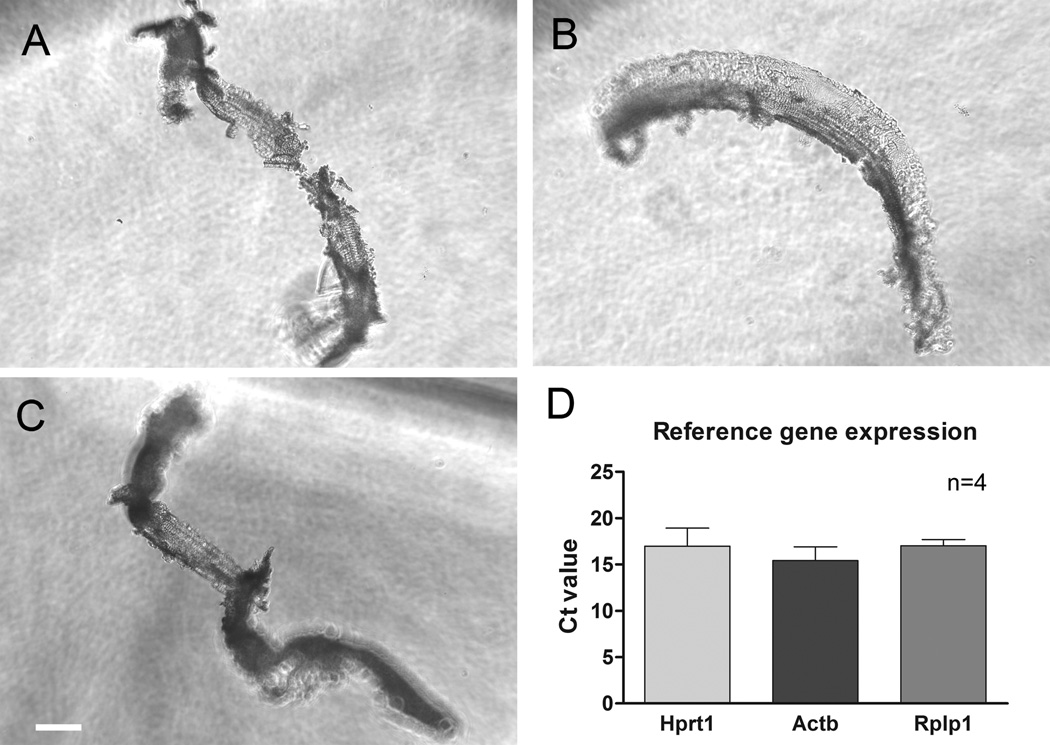
Figure 10.
Examples of sensory cell-enriched samples collected from rat cochleae. A), B) and C) A surface view of three typical sensory cell-enriched tissues is shown. The samples display a similar morphology to those collected from mouse cochleae. D) The average Ct values of three reference genes were calculated from the sensory cell-enriched samples. The lines above the bars represent one standard deviation above the mean. n= 4 experimental repetitions.

