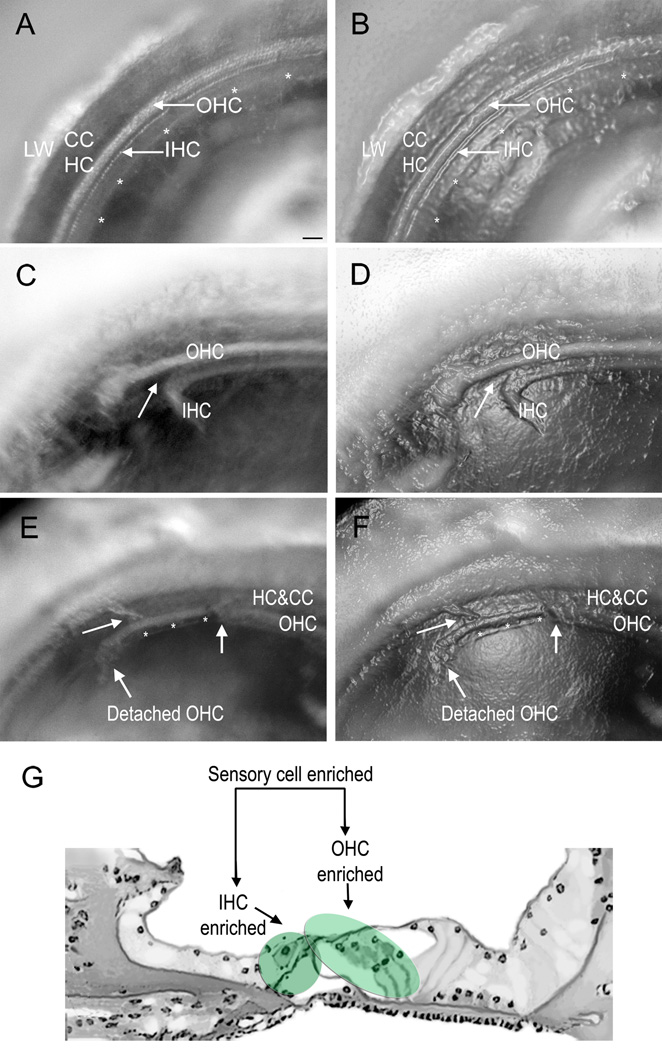
Figure 2.
Microphotographs of the sensory organ partition were taken at different stages of microdissection. To aid in the identification of the structures, the micrographs in (A), (C) and (E) have been enhanced with the “plastic wrap” function of Photoshop (Adobe Photoshop, CS3 Extended) to generate (B), (D) and (F), respectively. A) and B) A surface view of the tissue after the initial preparation but prior to microdissection. The asterisks mark the medial edge of the tissue. The white dots marked by arrows are hair cells. C) and D) A surface view of a cochlea after a portion of the IHC-containing region has been detached. On the left side, the IHC-containing region has been separated from the OHC-containing region. In contrast, the tissue remains intact on the right side. The arrow points to the site of separation in the pillar cell region. E) and F) A surface view of a cochlea where the OHC-enriched region has been partially separated from the Hensen cells. The IHC-containing region in this section has been removed (asterisks). On the right-hand side of the image marked by the arrow, both the IHC- and OHC-enriched tissues remain intact. G) A schematic drawing of the side view of the sensory organ partition. The shaded areas denote the regions for each type of enriched sample. LW: lateral wall. CC:claudius cell. HC: Hensen cell. OHC: outer hair cell. IHC: inner hair cell. Scale bar = 35 µm.

