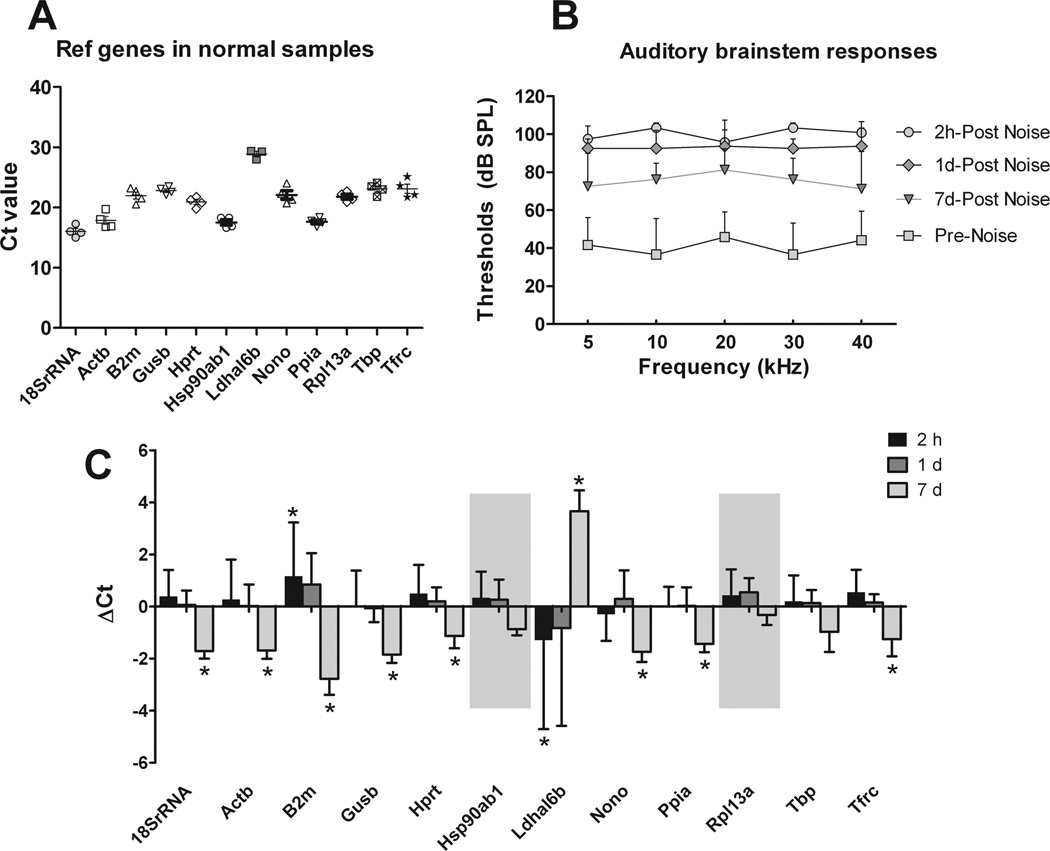
Figure 9.
The expression of 12 reference genes among the sensory cell-enriched samples collected from normal and noise-traumatized mouse cochleae. A) Ct values of each reference gene were determined from four experimental repetitions. Each dot represents the Ct value of each sample, and the lines represent the mean. B) Auditory brainstem response thresholds were measured before and at various time points after the animals were exposed to a 120-dB noise for 1 h. C) The Ct values of the reference genes after the noise exposure were compared with those measured in the normal cochleae. The asterisks mark the genes where a change in Ct value > 1 was seen. The shaded areas denote the two genes for which less than a two-fold change in expression was seen at all the time points after the noise exposure. The lines above the bars represent one standard deviation above the mean.

