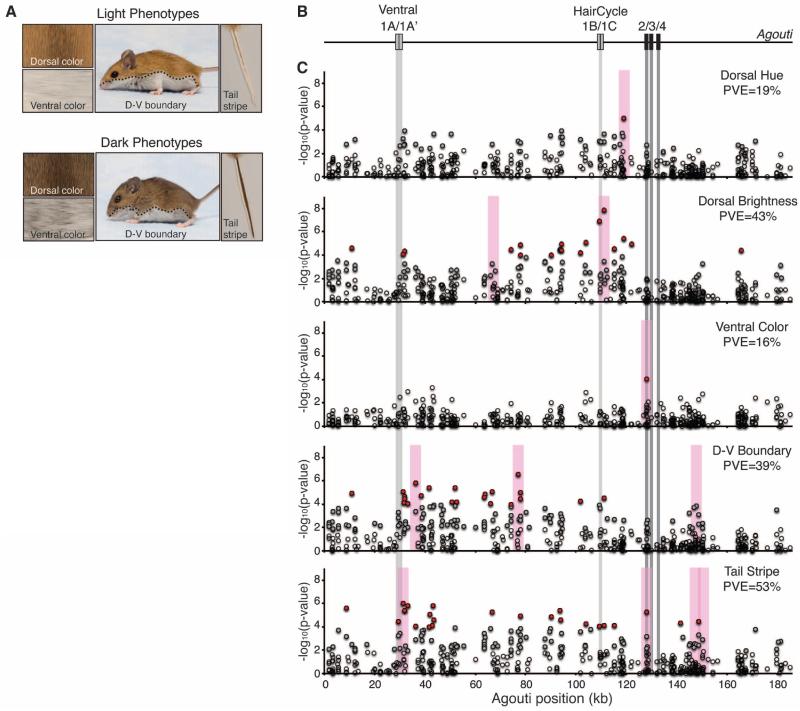
Fig. 2.
The light Sand Hills phenotype is composed of multiple traits, each mapping to different regions of Agouti. (A) Typical light and dark mice. Light mice have a brighter dorsum and ventrum, an upward shift in the d-v boundary, and a decrease in the width of the tail stripe. (B) Structure of the Agouti locus with coding exons (dark boxes) and untranslated exons (light boxes). (C) Genotype-phenotype association for 466 SNPs (circles) tested in 91 mice. SNPs significant after correcting for a false discovery rate (FDR) of 5% (gray circles) and after FDR and Bonferroni correction (red circles) are shown. Gray bars highlight the position of Agouti exons. Pink bars indicate the location of candidate SNPs for each trait (13). PVE by the candidate SNPs is given for each trait. All traits are significantly associated with variation in Agouti, and some traits map in or near known functional regions. Distinct patterns of association are observed for each trait.

